I must admit, I do have a bit of a soft spot for Volume.
You might have heard me talk about it before – it tends to be followed more closely by futures and stock traders than Forex traders, and it has a certain romantic appeal attached to it.
Traders like Jesse Livermore and Charles Dow (co founder of both the Dow Jones company and also the Wall Street Journal) used volume to make millions of dollars in the early 1900’s back when computers were just a figment of the imagination.
And even though their methods might seem antiquated I think the old-timers actually held an advantage over modern day traders…
They were forced to use only the purest elements of analysis in their trading decisions: the ticker tape reported prices and quantities (volume) traded – it came spooling out of a great glass-domed machine on a thin strip of paper – and I guess they had to look at the clock on the wall to keep track of the times.
If you read about their methods you’ll find they relied heavily on the relationship between price and volume to make their calls. It’s how they’d get a feel for the flowing currents of the market.
If the price was moving upwards AND bigger and bigger blocks of volume were hitting the market to buy, it told them the up-move had some genuine weight behind it. It was a good time to get involved.
But if the stock was moving upwards in price and the volume coming into the market was drying up, it told them the move was possibly on its last legs… a reversal could be on the horizon
So they had this way of using volume quite effectively to steer them into high-probability trading decisions.
Why does volume analysis get little attention
from most traders these days?
Using volume effectively is a bit more subtle than having a big green arrow flashing on the screen telling you it’s time to buy.
It will be right there available for you to use even on the most basic chart packages. But you do need to give a bit of thought to the relationship between the movements in price, and the amount of volume driving them.
Volume is what’s going to show you the intensity or urgency behind movements in price. Keep an eye on it and you can gauge the buying or selling pressure behind the move – it’s all about who’s being most aggressive, the buyers or the sellers.
And that can help you see beneath the surface of price movement… it’s what can help you gauge the tops and bottoms of those range bound markets, and it can also give you a clue that an eventual breakout is genuine or if it’s likely to fail.
But I’ve heard Forex doesn’t have volume!
That’s right, because Forex is a de-centralised market there is no definitive record of quantities traded. But most data providers do offer ‘tick’ volume. It’s a record of the number of trades taking place rather than the actual quantity of currency changing hands.
So a one minute bar on a chart of EUR/USD might show a volume of 300… that means three hundred different transactions took place during that minute. It’s not perfect, one trade might have been three times larger than the next, but it’s good enough to give you an edge to your decision making.
In fact, studies have concluded tick volume gives as much as a 90% correlation to actual volume. And remember, it’s all about the relationship between price and volume anyway. You’re watching how increasing or declining price is backed up by corresponding fluctuations in volume rather than studying volume alone.
So exactly how do you go about using volume in your trading?
There’s a bit of an art to it. It will take a bit of study and contemplation before you become an expert. But this is a perfect pursuit if you do enjoy a bit of analytical thinking and getting rewarded in a big way for doing it!
Here are some basic applications of volume analysis to get you going…
3 simple ways you could use volume to pick high-probability
trades in range bound markets
1) A potential reversal bar on high volume:
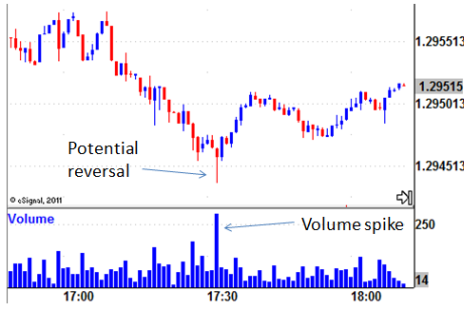
This almost certainly suggests a short-term end to the down-move. The long wick on the candlestick shows buyers have already moved the price against the sellers, and you can see the high volume confirming their presence.
You might see this type of price action at the bottom of trading ranges. It’s your signal to take profits on short trades and it’s also a potential entry point for long trades.
2) A breakout on increasing volume:
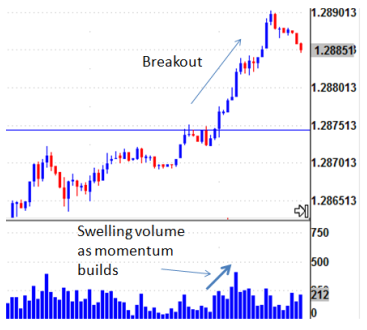
Here we see price breaking out through the top of a previous trading range on increasing volume. This shows traders are jumping onto the move and contributing to its building momentum.
You can take some confidence the breakout is genuine. Look to trade in the direction of the breakout.
3) A pullback on decreasing volume:
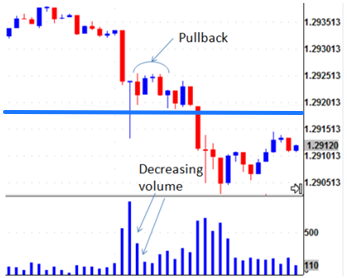
Here we see a potential reversal on high volume at the bottom of an established trading range but the immediate pullback in price doesn’t confirm further buying. The decreasing volume shows no more buyers are stepping in.
This means a continued push to the downside has a higher probability chance of playing out. Enter a short trade (or add to your existing short position) looking for price to continue lower.
– – –
Using volume along with a bit of logical thinking can give a whole new perspective to your market analysis. It can give you greater confidence in your trading decisions and give you ways to get involved even when the markets are wheeling sideways.
Give volume a try and see what you can uncover, you might be pleasantly surprised.