Today, I thought I’d walk you through a nice and simple Swing Trading technique.
It’s a handy one to have in your arsenal if you can’t watch the screen because it uses the bigger timeframes…
You can use it on the daily charts (handy if you like to monitor things in the evening) and it also works very nicely on the 480min (8 hour) chart.
Don’t worry…you won’t have to follow the charts too closely. You can just set an email or SMS alert with your broker.
That way, once you receive a message telling you the market is getting near the ‘action zone’, you just keep a casual eye on things until one of the bars closes in a particular way, giving you the signal to trade.
How to use the 89 period EMA
Now this setup is lifted straight out of the share-trader’s toolbox…
This is a ‘swing trading’ set up designed to get you in early on a developing trend and go looking for 2:1 or even 3:1 reward to risk trades.
It uses a basic exponential moving average to find good trades.
You’ll find the exponential moving average in all common charting packages – it’s sometimes called ‘EMA’ – and your chart will plot it all for you.
Please don’t worry about any technical sounding lingo. ‘Exponential’ just means a front-loaded moving average – it’s calculated to give a bias to the more recent price action, that’s all.
The reason this indicator can give you an edge is because it’s widely followed as a provider of support and resistance by the big players. You get a signpost pointed to where their volume is sitting in the market which you can then use to your advantage.
You’ll end up with an undulating line on your chart like the one below:
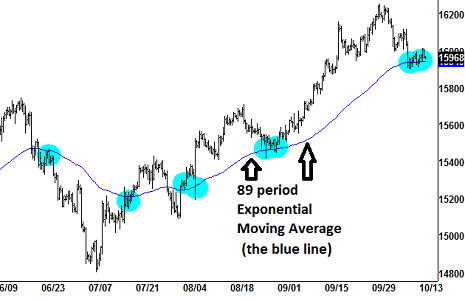
GBP/USD 8-hour chart
Can you also see the blue blobs I’ve drawn over the areas where the market comes into contact with the 89 EMA and then either stalls or reverses?
That’s a key part of the technique…
What we’re looking at is for the market to penetrate the 89EMA and then hold its ground on the new territory.
So, for example, if the market was trading above the 89EMA but then pokes its way through to start trading below it, we’re then looking for the 89EMA to offer resistance and keep the price action contained to the down-side.
That’s what happened here…
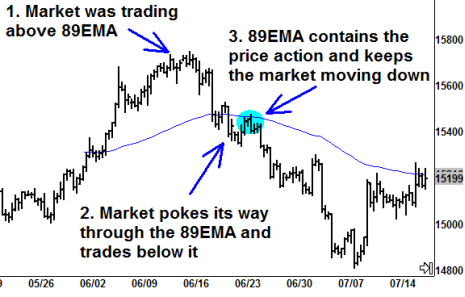
GBP/USD 8-hour chart
Part of our setup is to see the market recoil and retest the 89EMA line and then move away from it again aggressively as new selling volume hits the market.
I’ll zoom-in and swap over to candlestick charts now to give you a clearer view.
So here we are zoomed in on that GBP/USD example from above:
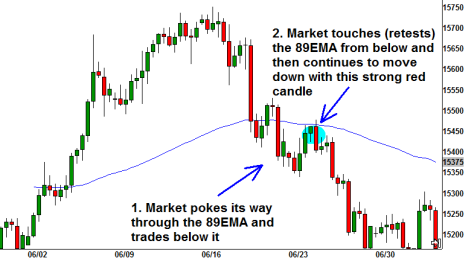
GBP/USD 8-hour chart
You can see the price action a bit clearer now… see how once it establishes below the 89EMA, the market pops up to probe the EMA from below?
It hardly manages to squeak through by a handful of pips before the sellers step in and dominate.
And once you see that strong bearish red candle close, that’s your signal to sell and join the party:
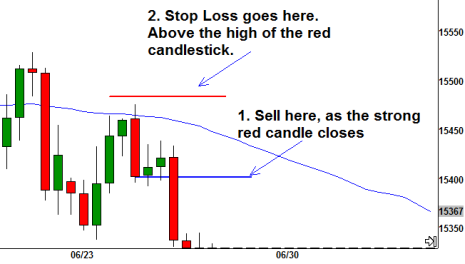
GBP/USD 8-hour chart
Once you’re in the trade, put a stop loss in above the most recent highs – in this case it goes above the high of our red candlestick.
You can then project your profit target downwards as a multiple of the distance between your entry and your stop loss. I suggest taking some profits once you’ve reached the 2:1 level and let the rest run on, aiming to close-out at 3:1.
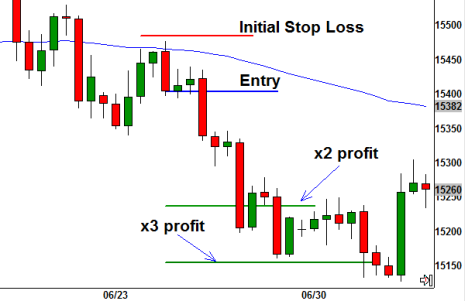
GBP/USD 8-hour chart
You should also get into the habit of trailing your stop loss closer behind you as the trade goes in your favour.
So that’s all there is to it really…
- Watch for the market to penetrate the 89EMA
- Wait for it to retest (touch) the 89EMA from the new side
- Look out for a strong candle as the buyers/sellers step in to reveal their hand.
And then get yourself involved right alongside them!
Be Prepared: Market Moving Data Coming This Week (London Time):
Wednesday 31st May:
08:55 EUR German Unemployment Change
10:00 EUR Consumer Price Index
15:00 USD Pending Home Sales
Thursday 1st June:
08:55 EUR German Manufacturing PMI
09:30 GBP Manufacturing PMI
13:15 USD Nonfarm Employment Change
15:00 USD ISM Manufacturing
16:00 USD Crude Oil Inventories
Friday 2nd June:
09:30 GBP Construction PMI
13:30 USD Employment Numbers!!
Monday 5th June:
09:30 GBP Services PMI
15:00 USD ISM non-manufacturing
Tuesday 6th June:
15:00 USD JOLTs Job openings
We’ve got the US employment numbers on Friday. It always has potential to move the markets, so hold onto your hats at 13:30!
Apart from that, remember we’re leading into the UK General Election on 8th June so watch out for any wild rhetoric, or shock opinion poll statistics, starting to move GBP markets.
Trade safe. And catch you soon…
Happy trading,
Rich Fitton