What do you see when you look at a trading chart?
‘Price’ will almost certainly be there. ‘Time’ may or may not make an appearance (depending on which kind of chart you’re using) and there may also be your own personal selection of indicators and studies.
But have you ever sat back to think what these pixels on your screen are actually showing you?
The map is not the territory after all.
No, what the chart illustrates is the aggregate position of every single participant in that market at a particular moment.
Every trader, from investment banks throwing around their size all the way down to the micro-lot Forex trader placing his first order, bears influence on the way the chart develops and prints.
And if we zoom in closer, we can divide all these players in the game into two camps: the ones who want the market price to go up (the Bulls) and the ones who want the market to go down (the Bears).
Yes, the market is basically an arena of two-sided conflict. Just the same as a chessboard, a battlefield, a rugby pitch, a US presidential election (!)… whichever image suits you best.
When traders attack and when traders defend
So we’ve got two sides, both with their own interests at heart. And both are prepared to use their own wily ways to win.
But if we zoom in closer again, we can even divide each team into two further broad camps.
Let’s call them the ‘attackers’ and the ‘defenders’. Here’s what each of them are up to…
A Bullish attacker will take advantage of upwards momentum in the market. He’ll be trading strength – looking to buy on breakouts beyond key levels, that kind of thing.
A Bearish attacker will do the opposite. He’ll look to sell weakness, taking advantage of breaks to the downside (which can be much fiercer than the up moves).
And the beauty of the attack is that by the time you’re in, the wheels of the market are already in motion. Once the trade is filled you tend to get your results (either good or bad) pretty quickly.
Over in the defenders camp…
A Bullish defender will try to buy weakness. He’ll be looking for levels of support below the current market that can give a low-risk buying point for his trades. He’s relying on high volume coming into the market from the big players at key levels to propel his own trades along. The defender can benefit from lower risk while volatility in the market is down, the payoff is he might have to wait a while before the anticipated move gets underway.
(And that’s not necessarily a bad thing… calling the trade correctly, way in advance of the rest of the market, can be a huge confidence booster!)
A Bearish defender of course does the opposite. He’ll be looking for levels overhead to sell into – finding resistance levels that make sense and selling into that strength as the market gives those levels a prod.
Let’s take a look at some real-world example of attacking trades and defending trades in the Gold market…
A bit of background first. Here’s a chart of Gold I’d been looking at some time ago. It’s a monthly chart so each of those black bars represents a month’s worth of activity.
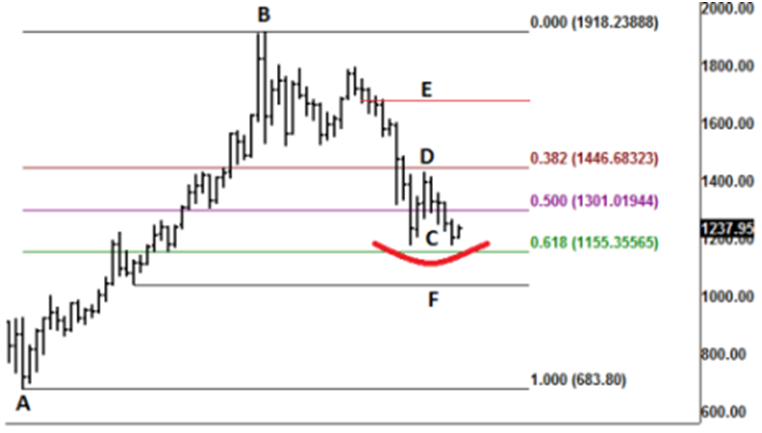
Gold Monthly Chart – US$/oz.
I’d been watching out for a double-bottom pattern forming right inside that area above the red curve.
A breakout above point D would confirm the pattern which then targets the line labeled E.
The big breakout never actually happened (remember how we need to deal with reality!) but that doesn’t mean there was a lack of good tradable opportunities.
So let’s get a bit closer to the market now. Here’s a ‘wide-angle’ daily chart showing the recent activity:
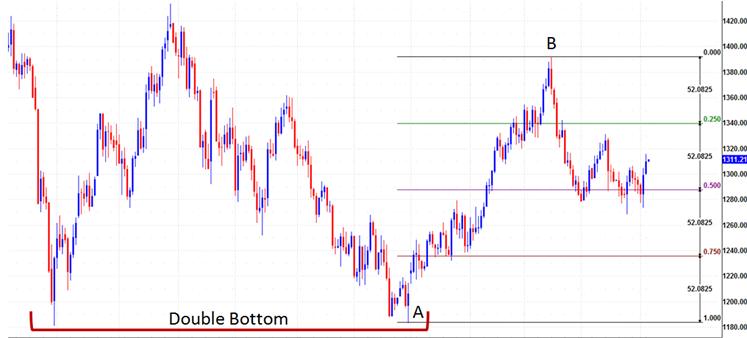
Gold Daily Chart – US$/oz
We’ll go in closer to the action in a minute, but on this chart you can see we’ve had a decent rally in recent weeks.
The second point of that speculative double-bottom (A) to the recent highs (B) was a $208.33 move.
The market has now retraced back to the 50% point of that move and it looks like that area is giving good support to the market.
So how can a Bullish trader try to take advantage of his buyer’s bias?
Here’s what a Bullish defender could look at…
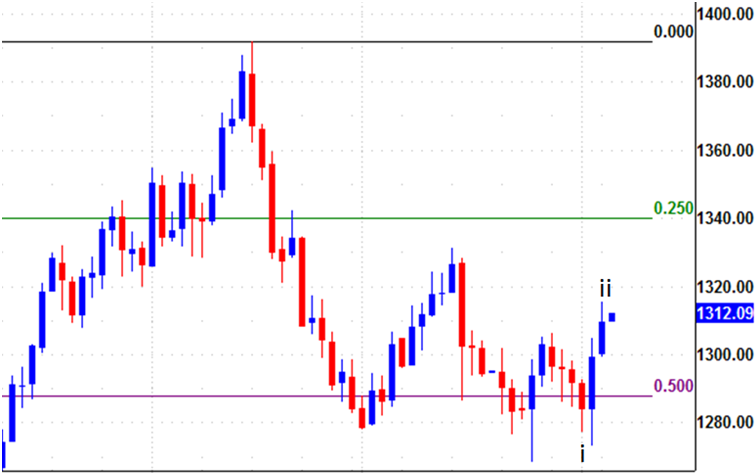
See how that broad 50% retracement area I mentioned (around the purple line) seems relevant to the market? That could offer a strategy for the Bullish defender… you could use a limit order to get you into the market if price takes another dip down there.
A more assertive strategy would be to use retracement levels, either the 50% level or the 38.2% and 61.8% levels, from the most recent pop-up (labeled i to ii on the chart) as your initial entry point.
Keep recalculating the retracement levels if the market carries on going up. But once you’re in, pull your stop to break-even as soon as possible, and then try to hang on for the ride!
Below is what a Bullish attacker could be seeing…
The Bullish attacker needs to find key breakout points to get him into the market…
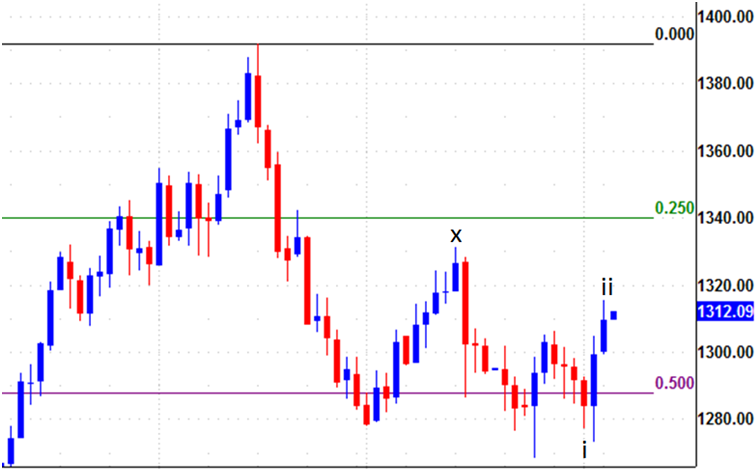
Here are two ideas:
1) Entering a breakout trade using a stop order a couple of ticks above (x) on this chart would target the green 25% retracement level. The attacking trader could enter the trade and pull his stop loss up to breakeven as the green line is touched and then try to hang on for the move higher – targeting those recent highs in mid-March.
2) Enter a trade using a stop order on a breakout above the next pullback to happen. For instance, if the market were to close lower than (ii), place a stop order to get you long a couple of ticks above (ii) the following day. This trade would first target a retest of (x) and then the green 25% line so again, you’ll know when you can pull your stop loss to breakeven as a safety measure.
Of course, if you trade the intraday timeframes there’s nothing to stop you scoping-out similar opportunities on the 4-hour, the 60 minute, or whichever timeframe you’re happy with. And if you keep your risk tight on those trades while still holding out for the longer term targets you can start to see some spectacular returns.
So give the attack and defence some thought next time you’re examining your charts. It should give you much deeper insight into the reality the market is showing you. You might also get a flash of inspiration for your next great trade!

Be Prepared: Market Moving Data Coming This Week (London Time)
Wednesday 16th November
09:30 GBP Average Earnings Index
09:30 GBP Claimant Count Change
13:30 USD Producer Price Index
15:30 USD Crude Oil Inventories
Thursday 17th November
09:30 GBP Retail Sales
10:00 EUR Consumer Price Index
13:30 USD Building Permits
13:30 USD Core CPI
13:30 USD Philly Fed
15:00 USD Yellen testifies
Friday 18th November
08:00 EUR Draghi speaks
Monday 21st November
– no big reports
Tuesday 22nd November
15:00 USD Existing Home Sales
As always, shoot me an email with any questions or queries and I’ll catch up with you again soon.