 Plus: A trading book that’ll make your toes curl
 Plus: A trading book that’ll make your toes curl
I spent most of Saturday in my study, poring over weekly charts.
I keep an eye on the daily and hourly charts throughout the week but I’ll do a ‘bigger-picture’ overview as we approach month-end. Doing this lets you refresh your outlook on the markets and flags up any new and interesting little areas of price-action you might be able to exploit.
Today, I thought I’d walk you through one of the simple analysis methods I use. It’ll let you find high probability price points to trade around in the coming weeks.
I’ve done this so many times now it almost happens on autopilot. But even so, I’ve still got the ragged-edged, tea-stained checklist I typed out for myself many moons ago.
I pull it out of its ring binder every now and then, just for old time’s sake. It gives me the feeling my old mentors are looking over my shoulder. It makes me double-check I’m doing things thoroughly… not getting sloppy.
Because believe me… back then, I did not want to give those two gruff geezers reason to tear a strip off me. They could be ruthless, making you feel about two inches tall!
So here we go – question number one from that well-thumbed checklist…
“Who’s controlling this market?”
Sounds a bit cloak-and-dagger I know, but I’m not talking conspiracy theories here. This is the technique we use to figure-out who had the upper hand during the last dominant move the market made – the bulls or the bears.
You can then calculate where the big players are next likely to step-in with their high volume trades. It’s all about being aware of what’s happening on the bigger stage.
And it’s very useful to know, even if you actually enter your trades on a day-to-day or hour-to-hour basis.
Here are the three main benefits to your trading by keeping aware of dominant moves and the key price levels they can give you:
You can use the dominant levels you uncover as target prices for position-plays you might be involved in. Don’t risk trying to squeeze your trade through one of these price bands when probability favours a pause or a reversal.
You can filter out low-probability trades your current system flags up. If you trade signals off a daily chart and it’s telling you to go long right underneath one of these ‘steel-reinforced’ dominant levels, why take the risk? Bring the dominant levels into your toolkit – make them part of your system – and you can keep the odds on your side.
You can start to build a new position straight off the levels. Fade the move that reaches the dominant levels – selling into the rally or buying the dip – with an initial first-entry sized trade. Build your position as the market moves away and proves your judgement correct. This is how Jesse Livermore got his juggernaut sized trades rolling.
And the process you’ll go through to find the dominant levels is simplicity itself…
First, find the ‘dominant leg’ of the market by simply eye-balling the chart. You’re looking for the last move the market made that contains all the price action coming after it.
Next, divide that dominant leg into quarters and draw in the retracement levels – 25%, 50% and 75% of that move. It’s a positive sign to see the price action already pivoting around those price levels. It shows you the market is paying attention to them.
Finally, use the levels you’ve uncovered to help steer your trading decisions as suggested in above in points 1-3.
It’s as simple as that!
Cable has these interesting levels in play:
I’ll walk you through GBP/USD (Cable) as a working example. It’ll help you understand the technique, plus, it’ll give you some live levels to consider in the coming weeks.
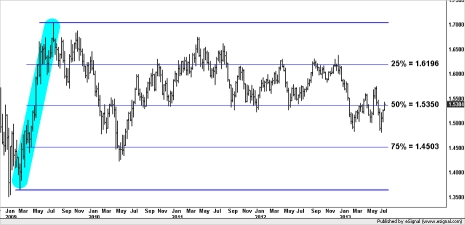
GBP/USD – Weekly
On the above weekly chart I’ve highlighted the dominant leg. You can see how it contains all the later price action. I’ve marked the 25%, 50% and 75% retracement levels and you can see how the market’s been responding well to them – see how it’s been pinging around between the 25% and the 50% levels?
What makes Cable a great current example though, is this… there’s another ‘internal’ leg – a kind of intermediate move – we can take more levels off and get an even tighter picture. Here it is highlighted orange:
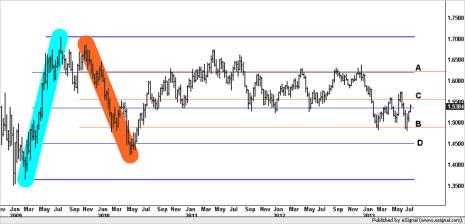
GBP/USD – Weekly
Let’s see what we can learn from this new information:
A – See how 25% of the original dominant move (the blue one) and 25% of the internal move (the orange one) converge here, right on top of each other? No wonder it’s been providing strong resistance for the last eighteen months!
B – The 75% level of the internal leg has given strong support on the two tests so far this year. A good sign the market is paying attention to the range of orange levels in their own right.
C – This is the 50% level of the internal leg. It’s seen a bit of action already but keep your eye on this one if the market continues its current push to the upside (1.5558).
D – This is the 75% level of the dominant leg. The market reversed off it already, back in May 2010. It’s where I’ll be watching (1.4513) if the market reverses and makes a new push to the downside… a great technical target for any short positions you might have built in the meantime.
As you can see, there’s not a great deal of effort involved in working this stuff out. But take the time to learn it and you’ll start to feel like a real market insider. You’ll get a huge boost in confidence once you’ve figured-out a level by yourself and then watched the market pivot straight off it!
It just shows you… there are no real ‘secrets’ in trading – just things you perhaps don’t know about yet.
If you weren’t aware of these robust price levels, it’s easy to see how trades you’ve taken in the past might have come to a sticky end without you really knowing the reason why.
And that’s ok – nobody is born knowing this stuff. You pick it up through experience.
You will always get those that know better of course…
Casually mention you’ve had a specific price on your radar for the last 6 weeks and they probably won’t believe you. But show them the price you were filled at – maybe a full 160 pips better than they were – they might just start sitting up and taking notice!
Recommended Reading:
Rogue Trader – Nick Leeson
The kids have finished school for summer so I’m scanning my bookshelves here, looking for more pool-side reading to take away on holiday.
Hmm, here’s a hair-raising tale for you. It’s what first got me interested in trading – Nick Leeson’s Rogue Trader.
You might have seen the film already, but read this book for the trading insights that Nick spills.
Halfway through the book, there’s a photo of the glum faced trader with this simple caption:
“At the time this photo was taken, August 1994, I was sitting on losses of around £80 million”.
Problem was, he had only just begun to scratch the surface. He eventually went on to lose $1.3 billion and wiped Baring bank out!
Some of what he did will make your toes curl. But the lessons he has for you come from the extremes of personal experience.
You can find it on Amazon here
Be Prepared: Market Moving Data Coming This Week (London Time – BST)
Some big USD reports this week: Second quarter GDP on Wednesday afternoon with the Fed’s Interest Rate decision later that evening. Jobless Claims and ISM on Thursday, and our old friend – the US employment situation – ends the week with a bang.
Wednesday 31st July:
13:30 US 2Q GDP (USD)
19:00 US FOMC Interest Rate Decision (USD)
Thursday 1st August:
12:00 UK BOE Interest Rate Decision (GBP)
12:45 EUR ECB Interest Rate Decision (EUR)
13:30 EUR ECB Press Conference (EUR)
13:30 US Initial Jobless Claims (USD)
15:00 US ISM Mfg. Index (USD)
Friday 2nd August:
13:30 US Employment Situation
13:30 US Personal Income and Outlays
I hope you enjoyed this article. If you get chance, have a go at finding the dominant leg in the markets you follow. Let me know how you get on with finding your levels, until next time…
Happy Trading.