 I’ve been working on the longer term charts this week…
Just reminding myself of the price action we’ve seen throughout 2013, and inking in a few key levels to trade off as we move into the New Year.
I thought I’d share some of my research with you today.
You’ll get to see a longer-term chart for each of the four most actively traded Forex pairs…
And it’s good practice to really zoom out like this from time to time. It lets you find solid support and resistance levels you can bring into your trading… ones you might overlook if you’re too tightly focused on the smaller timeframes.
We’ll go through each chart in turn and uncover the most prominent and interesting price level… something really meaty you might choose to build into your own analysis as we roll into 2014.
Let’s make a start with the Euro…
1) EUR/USD – (Euro against US Dollar)
EURUSD – Weekly Chart
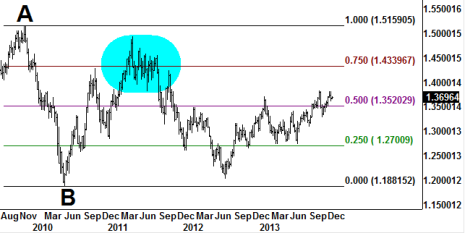
The controlling move in EURUSD is that drop down from point A to point B on the chart. It took place from November 2009 into early June 2010. And despite being a few years old, it’s still providing major retracement levels the market is paying attention to.
You can see how the 25% level (Green line) has been tested from above and below on five or six occasions.
The 50% level (Pink line) has also seen its share of activity. And I would pay close attention if we get a drop back down to that level (1.3520) in the coming weeks – the market is trading not too far above at the moment. I would expect the 50% level to give at least short-term support and resistance, even if just on the intraday timescales.
The big level I’m watching on EURUSD is the 75% retracement area (maroon line – 1.4339). It dissects the high volume congestion area highlighted blue and the combination of those two prominent features – 75% retracement plus a retest of the congestion area – should give us something solid to work with if the market makes a run to the upside. You could consider covering any long positions as we approach that price area or initiate speculative short trades.
EURUSD Key Level = 1.4339
We’ll have a look at the Yen next…
2) USD/JPY – (US Dollar against Japanese Yen)
USDJPY – Monthly Chart
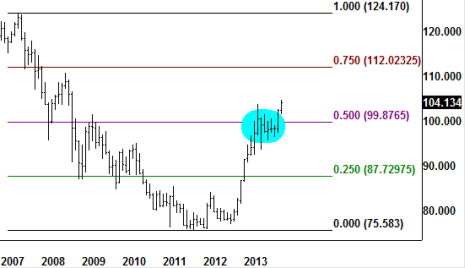
This market has rallied quite impressively off its 2012 lows. It found resistance at the 50% retracement level (Pink line) and has only managed to squeeze through there in recent months.
I think the key price action in this market is maintaining trade above the 50% level. I wouldn’t be surprised to see a dip back down there and would expect Bullish players to step in and defend the level if that were the case.
If the rally does continue unchecked, keep one eye on the 75% level (112.00 area) for some selling pressure coming in.
But for me, it’s all about a retest of that 50% level…
We’ve got the 50% level itself, we’ve got the volume laid down during that little area of chop (highlighted blue), and we’ve got the psychological aspect of the round number 100.00.
All three of those elements combine and come into play here. They give us a good level to work with if the Yen does take a dip back down. It could work as a target area for any short positions you’re holding at the time, or a place to initiate new long trades if you maintain a Bullish outlook on the market.
USDJPY Key Level = 99.88
Cable is up next…
3) GBP/USD – (British Pound against US Dollar)
GBPUSD – Weekly Chart
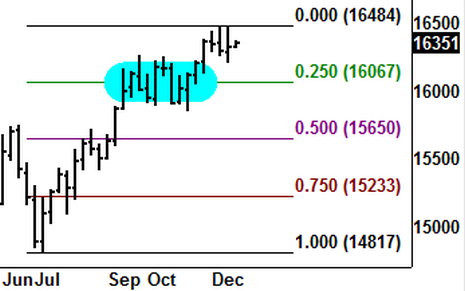
The move up from July 2013 to recent weeks gives us a controlling move to work with on the Weekly chart for Cable (GBPUSD).
The 25% retracement level (Green Line – 1.6067) dissects the congestion area highlighted blue nicely…
When you see sideways action like this, you should think about the level of trading volume laid down as the buyers and sellers had their little tug-of-war. These are the areas the market loves to retest once it has made a move away from the area.
If the price band was important enough to fight over the first time, chances are there’ll still be sentiment attached. And that can draw players in off the sidelines when the market trades there again.
I’m looking at 1.6067 as a potential target area for short positions with the possibility of day trades/scalps to the long side. I’d just like to see some real buying intent from the market at large before considering this area as solid longer-term support.
The risk here is that the market could easily make a strong push down towards the 50% level (the little breakout above congestion doesn’t look so solid as things currently stand).
If we did take a dip down to 50% I would then look at our 1.6067 as good overhead resistance.
So we’ll use the 1.6067 area on Cable as a Pivotal level. It’ll be watched by the market but I think you need to be prepared to play it either way, from above or below.
GBPUSD Key Level = 1.6067
On to the Swissie now…
4) USD/CHF – (US Dollar against Swiss Franc)
USDCHF – Weekly Chart
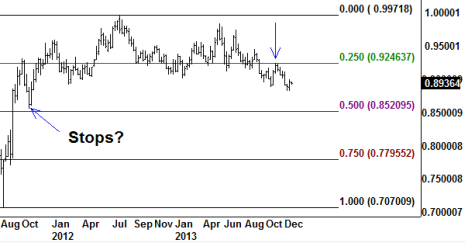
Here we have a controlling move created from the lows in August 2011 to the highs in July 2012.
You can see how the 25% retracement level (Green line 0.9246) has already proven important to the market. See how the price action revolves above and below the green line?
It’s acted as good support throughout the early part of 2013 but the bulls finally lost their grip with the break down through the level in September.
Since then, the market has popped back up against the 25% level only to be repelled and turned lower (see the blue arrow). It’s the age-old concept of support becoming resistance at work.
We then have an interesting proposition on the next potential leg to the downside…
The 50% level (Pink Line – 0.8520) is always worth considering as support. But we also have an obvious technical location for Bullish traders to have placed stop-loss orders…
It’s just above the 50% level at those intermediate lows of 0.8567.
Could we see a push to the downside that triggers sell stops with Bullish players ready to step in and soak up the sell orders? They could use the 50% level as solid support to lean against and fill their boots.
No guarantees of course. I’m not talking about predicting the future. But try and think how an institutional trader thinks – long term and always with the issue of getting huge volume away at the best possible price. You can uncover some really interesting strategic ideas to test and develop for your own day-to-day campaigns.
USDCHF Key Level = 0.8520
So I hope that simple analysis gave you food for thought.
Remember, no one knows in advance what’s going to happen next, it’s all about playing the probabilities. But once you do make yourself aware of the kinds of things the deeper market pays attention to, you can swing the odds of success right over in your favour.
Be Prepared: Market Moving Data Coming
This Week (London Time):
We’ve got a very quiet week ahead on the economic reports as you might imagine.
If you are planning to trade over the Christmas period please also be aware of ‘thin’ trading conditions. Much of the usual liquidity will not be in residence. Be careful not to get caught out by any quirky moves the markets may make.
Wednesday 25th December:
Christmas Day Holiday
Thursday 26th December: Boxing Day
13:30 US Initial Jobless Claims USD
Friday 27th December:
No significant reports scheduled
Well, that wraps up 2013…
I’m off to spend a few days with the family while the markets are quiet. Just hope Father Christmas gets everything right… the children’s wish lists must have changed at least five times each before their final editions went up the chimney!
Since this is the last issue of FxFxFx before the New Year I’d like to wish you a very Merry Christmas and a prosperous 2014.
As always, don’t hesitate to drop me an email with any comments or questions. And I’ll catch up with you in the next issue – it’ll be with you Tuesday 7th January 2014.