 Since the markets jumped off a cliff back at the beginning of August, most of the major indices have been jittering about in a wide sideways range.
For the FTSE, the upper boundary of this range has been marked by the 5450 level, with plenty of activity below this line, but whenever the price moves up towards these levels, sellers have been coming in and driving the price back down.
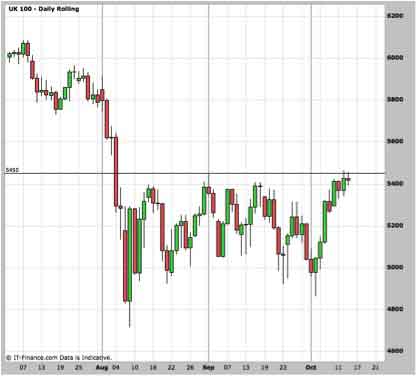
This week, however, the FTSE has been leaning against this level, edging through it, and giving breakout traders cause to hover nervously over their charts, waiting for a signal to act.
The question is – will the price bounce back down off the 5450 level, or break through it?
And for breakout traders – how do you confirm a market move above this level as a breakout, rather than a fake out?
Using candles to confirm a market move
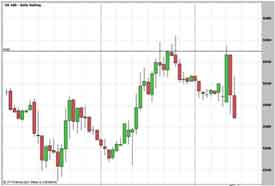
As you can see on this hourly chart of the FTSE, taken yesterday morning, prices have pushed through 5450, but each time bounced back down.
Each trader will have their own personal criteria for confirming a breakout, so I’ll take a look at a few here that don’t require any extra indicators:
- A candlestick closing through the line of support or resistance.
- A close on the other side, then a retracement back to the line, then a close beyond the first close. (Retesting the trend line from the other direction is a great test that it’s turned from resistance into support, or vice versa.)
Momentum, indicated by bigger candles as you approach the breach of the trend line.
All of these are good ways to confirm a breakout, but another popular method applied by traders is the addition of the RSI indicator.
Test of strength
I really don’t hold much faith in RSI overbought and oversold readings.
You only have to take a glance at the wild market swings we’ve seen in recent months to know that an “oversold” reading (i.e. the RSI reading below 30) is no indicator that the market doesn’t have a long way further to fall.
And I’ve no reason to think that global markets will be any surer on their feet in the months ahead.
So, if we’re looking for a breakout, we’ll expect that breakout to come with a degree of momentum. And I’ll use the RSI indicator to find that momentum – RSI measures speed of a move… so if that speed is increasing… momentum will be building…
I’m talking about RSI convergences.
So, if the price is moving up through our trend line, I’ll want the RSI indicator so be showing higher highs, signaling building momentum.
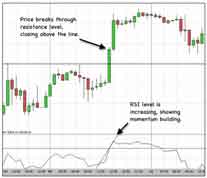
This kind of RSI reading suggests that traders have their foot on the pedal, and can drive this price higher.
Which is the best signal?
I’m afraid there’s no set answer as to which is the best way to confirm a breakout.
It depends on your style of trading and how you expect that trade to perform.
If you’re looking for a safer signal – you’re likely to be hanging around, waiting for confirmation. In which time, you’ll miss some profitable moves.
If you’re looking to get in on moves quickly – you’re going to fall prey to more false breakouts.
What’s important to remember is that none of these methods are perfect; there will always be fake outs, whichever confirmation method you chose.
And that gets to the heart of finding a trading signal that works – it’s not about being right all the time (or even most of the time). Instead, it’s about understanding how often you can expect to be right, how much you’re risking, how much you’re making, and whether you can maintain an edge over the market.
Some of the most successful traders I know are using incredibly simple breakout signals – their success comes from managing those trades and their funds.
More on this to come…