A number of my readers have been asking just how reliable a single candlestick signal can really be for entering a trade…
Well, if you were going to rely solely on a doji candlestick to open a trade – I’d be concerned. But used in conjunction with other indicators, a doji is highly effective.
Why?
Well, there are a number of reasons why a doji is such a powerful tool for traders, and – this might surprise you – they aren’t to do with how often this candlestick gets it right.
In fact, dojis only accurately predict a reversal about 50% of the time.
So they get it wrong as often as they get it right.
However, when used cleverly, there’s nothing random about the kind of profits you can pull in by using a doji signal.
Recognizing a doji candlestick signal
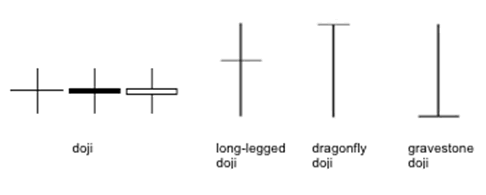
If you’re not familiar with doji candlesticks, they come in a number of shapes …

They are very, very easy to spot.
It can take a bit of practice to pick out triangles and flags, or double tops and head and shoulders.
But a doji is something any trader can pick out in a couple of seconds.
The key element in any doji is the long wick or wicks and the lack of a body (or a very small body).
These things mean that the market has moved considerably during this session, but that the price has closed at exactly the same level it opened. It tells us that there is indecision in the market.
Dojis don’t tell us that the market is going to turn – they just tell us that the market doesn’t know which way it will go next.
Another good thing about dojis is that they are relatively common.
It’s all very well having a powerful candlestick signal. But if you have to wait six months for a set-up to come along you’re not going to get very far with your trading.
But dojis come along pretty often. And if one trade doesn’t work out for you – you can be confident that there will be another one along soon.
The built-in safety system
So, dojis are common … they’re easy to spot … and they tell us that the market might reverse … or it might not …
Why is this information so useful?
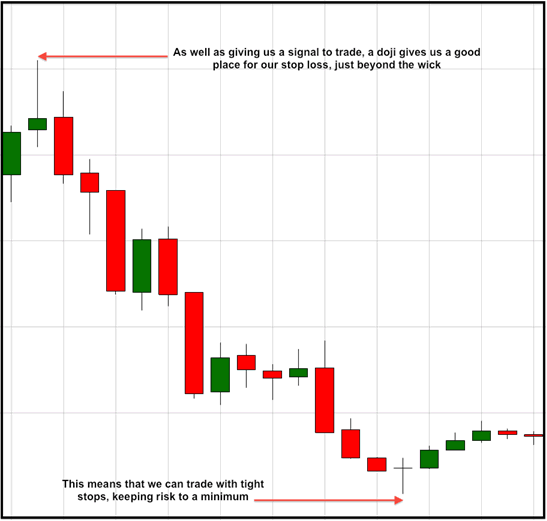
Well, a doji might only get it right 50% of the time, but the real advantage of using a doji is that it is a candlestick that comes with a built-in level of support and resistance for your stop loss.
That means that you can trade dojis with tight stops.
Which, in turn means that you can pick up big rewards in relation to your risk.
And that means that you don’t need to be right all the time.
You don’t even need to be right half the time!
When you’re right – you can pick up big rewards.
And when you’re wrong – you should be able to cut your losses quickly.

If you want to test out a really effective way of picking up trades like these, I recommend that you take a look at this.
This week’s news …
It feels like we’ve been worrying about the potential of a double-dip recession for so long now, that it’s final arrival this week has been a big anticlimax.
The markets barely shrugged their shoulders.
In fact, the markets have been aware of the poor figures coming out of the UK and Eurozone for some time now, and after the truly terrible European PMI numbers on Monday, the news of a double-dip in the UK when GDP figures were released on Wednesday was just another piece of straw on the already-broken back of a camel.
It simply isn’t fair to compare our recovery (or lack of it) to that in the US. They are very different beasts. And the UK is inextricably linked to the fortunes of the Eurozone, and we all know about the trouble they’re in.
In fact, the markets remain bullish. Growth may be achingly slow, but there are still signs of life.
There are some stumbling blocks for the FTSE between now and 6000. But if we take a look at the Dow, which has already nudged through 13130 this week, there’s little resistance between here and yearly highs at 13,300.
In the next seven days …
Many economists are hopeful that this week’s GDP preliminary figures are wrong, and will be looking for signs that they’ll be revised up at the next stage.
One potential signal will be the PMI levels next week. Following hot on the heels of this week’s poor Eurozone PMIs, the UK manufacturing (Tues), construction (Wed) and services (Thurs) will give a good picture of just how far the UK is being dragged down by its major trading partner.
The French presidential front-runner, Francois Hollande, has urged the ECB to lower its interest rates further. So far, they’ve resisted pressure, but following the figures we’ve seen in the past week, we’ll find out on Thursday if they’ve been swayed.
Of course, the main number-watching next week will be the non-farm payrolls on Friday afternoon. Last month, these disappointed with a net rise of just 120,000 jobs. A repeat of this would be bad for the dollar, and for equities as a whole.
