Does cluttering our charts with a plethora of technical indicators really make us profitable traders, when one simple fact remains:
Every single technical indicator EVER developed is based on a maximum of 5 data points – Open Price, High Price, Low Price, Close Price and Volume.
Why it is best to keep it simple
How many times have you found yourself staring at your charts suffering from trading “Analysis Paralysis”?
Wikipedia describe “Analysis Paralysis” as:
Over-analyzing (or over-thinking) a situation, so that a decision or action is never taken, in effect paralyzing the outcome.
“Analysis Paralysis” is often the reason why the more experienced traders go through a phase of stripping their charts of almost all indicators and work simply on understanding the rhythm of the market based only on how the price moves in relation to volume. This approach is how many scalpers trade the markets and it has been argued that this is the purest form of trading – when you are completely in-tune with the market, most likely to read the ebbs and flows, and ultimately most likely to make money with real confidence and consistency.
This is the essence of an approach called Volume Spread Analysis (VSA).
Volume Spread Analysis and why it could transform your trading
Volume Spread Analysis combines volume with price action to find trading opportunities. In this article I will provide a high level overview of the basic VSA concepts and show you how it can be used as part of a trading strategy.
Firstly, let’s take a look at the individual components of VSA:
Not all volume is created equal
In any market, price is determined by supply and demand. If more people are buying, then prices go up, if more people are selling then prices go down. The number of market participants is reflected in the volume. If there are more participants then there is higher volume.
It is long thought that the markets move because of “smart money” (e.g. institutional or hedge fund money) so if we are able to identify “smart money” and copy what they are doing we would be able to benefit from whatever information they are acting on. When ‘smart money’ enters the market this is normally means higher volume.
Introducing the concept of “Price Spread”
When smart money enters the market, the price will invariably move. This is reflected in bars with higher than average spreads or ranges. The range of a bar is the difference between the highest and lowest price on the time frame you are looking at.
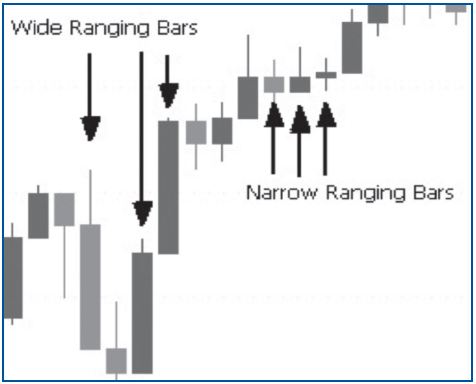
Figure 2 – A candlestick chart showing wide and narrow ranging bars
In the example above we see three bars that have a wider range than the other bars. If these bars were accompanied by higher than average volume, then we get a good hint that the smart money has entered the market. It is now our job to follow this smart money.
Using VSA to stay on the right side of the market
By bringing together Volume and Price Action and identifying certain patterns between the two we are able to identify periods where smart money is moving the market.
VSA offers the following possibilities:
1. Bullish Volume is where the volume is increasing when the price is going up and
decreasing when the price is coming down. Figure 3 shows the FTSE in an uptrend from
September to December 2010. Figure 4 shows the first two weeks of September when the
market moved sideways on low volume, indicating that no smart money was supporting the potential move downwards
2. Bearish Volume is where volume is increasing when the price is going down and decreasing when the price is going up.
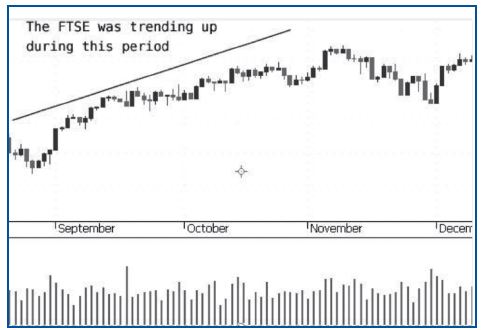
Figure 3 – FTSE uptrend Sept to December 2010
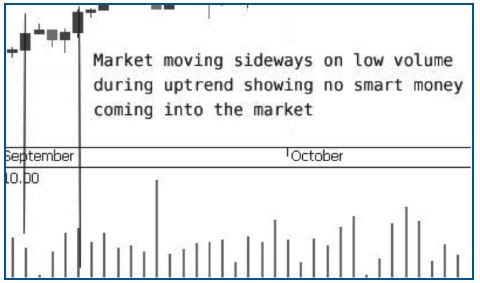
Figure 4 – FTSE moving sideways in early September 2010 on low volume
When taken in isolation, these theories do not provide one with a complete trading strategy but do provide enough information to stay on the right side of the market.
VSA as a method of identifying potential reversals
Correctly identifying market tops and bottoms is notoriously difficult and often the reason that indicator-based traders fail (certainly a trend-trading system during a period of chop will invariably identify buying opportunities at the top of the trend and selling opportunities at the bottom).
Volume Spread Analysis can be used to help identify market turning points:
1. In an uptrend, if volume is exceptionally high but price spreads are narrow (or the bar has a long neck) then buyers are losing control of the market and a top may be forming.
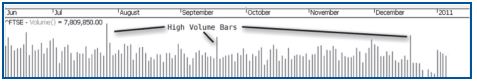
2. In a downtrend, if the volume is exceptionally high and price spread is narrow (or the bar has a long tail) then sellers are losing control of the market and a bottom may be forming. Figure 5 shows both types of reversal scenarios described above. The first reversal bar (Mid April 2010) show high volume in an uptrend with a narrow ranging bar, indicating that smart money no longer supports the uptrend. The second reversal bar (in early May 2010), shows high volume during a downtrend with a bar that has a long tail (meaning the bar closed some distance from its low point)
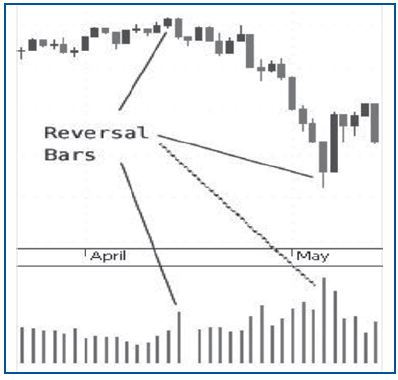
Figure 5 – Reversal Bars on the FTSE
Lets consider what actually happened during the formation of the reversal bar, which occurred in May 2010 as is shown in Figure 5.
1. Higher Volume – This means more market participants
2. Bar closed some distance from the Low – Despite downward pressure in the market; the bar did not close near its lows, meaning that the volume was predominantly buying – signifying a potential reversal.
Does Volume Spread Analysis always work?
No technically-based trading system works 100% of the time and VSA is no exception. There are times when a “reversal bar” forms, only for the stock to carry on trending in the same direction. In order to manage this it is important that traders always use stops as part of their trading methodology and exit positions that are not “working in their favour” as soon as possible. Professional traders will risk no more than 0.5% of their account on any one position – this means that a trader with a trading account of £100,000 will lose a maximum of £500 on a losing trade.
What markets does Volume Spread Analysis work on?
Because of the nature of VSA this technique works on ALL markets where price and volume information are available (the obvious exception to this is currency trading, where volume is not available) – However, VSA can be used on stocks, commodities, metals, indices and bonds.
The bottom line
Every trader at some point in their trading career will suffer from “analysis paralysis” – trying one technical indicator after another in an attempt to find something that works for them. Volume Spread Analysis is a solution to this problem as it relies simply on Price Action and Volume and can be used to really understand what and how markets move. By studying and understanding VSA a trader can move one step toward the holy grail of Trading For a Living.
VSA Resources:
• Search Google for “Volume Spread Analysis”
• Subscribe to the AtticManTraderTV YouTube channel for videos covering a wide range of trading subjects including VSA. You can access the channel here – click playlist and then select “Trading 101”
About AtticManTrader
Daniel Jackson is a full-time stock and index trader who swing trades FTSE 350 stocks and day trades the US indices. His trading journal can be found online at his blog. The blog is a frank and honest account of his trading journey and covers many trading topics including strategy development, risk and money management, journaling, record keeping and trading plans, swing and intraday trading ideas and strategies and trading psychology.
Sign-up to Daniel’s blog and get a free copy of his trading journal software here
You can also follow Daniel on Twitter