 Before we litter our charts with oscillators… Bollinger bands… SARs… and moving averages…
It’s a good idea to make the most out of the simple straight line.
On any price chart, there are a number of straight, horizontal lines we can draw that will give us clues as to where prices will hesitate and where they will turn.
The most important of these are historical support and resistance lines. You can find out exactly how to get these on your charts and how to use them in this previous Maven post.
But these historical lines aren’t always enough when it comes to day trading, which is why today we’re going to look at adding an extra 5 lines onto our charts each morning.
These lines are called pivot points.
Daily Pivot Points
If you haven’t used pivot points before – there’s nothing complex about them. They are some key levels calculated for each day, based on what the price did the previous day.
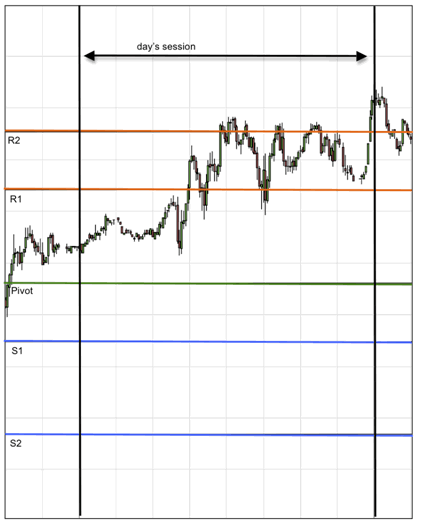
You have a central pivot point, plus two above that, which are called Resistance 1 and Resistance 2 (R1 & R2), and two below the central point, called Support 1 and Support 2 (S1 & S2).
(You can go further with pivot points, to S3 … R3 … M1 … M2 … and beyond, but we’ll stick with the basic five lines to start with.)
When drawn up on your chart, they’ll look something like this …

Don’t be put off by the names S1, R1, etc – all the lines on the chart can offer support or resistance.
Some charting packages will draw your pivot points at the click of a mouse, but there are plenty of free pivot point calculators you can download online to do the job for you – a quick Google search should give you plenty to choose from.
Failing that, the calculation is very simple to do yourself. Here’s the maths bit …
(H = previous day’s high; L = previous day’s low; C = previous day’s closing price):
P = (H + L + C) / 3
R2 = P + (H-L)
R1 = (P x 2) – L
S1 = (P x 2) – H
S2 = P – (H – L)
So, if you’ve got these marked up on your chart at the beginning of the day, how should you use them?
Pivot Point Trading
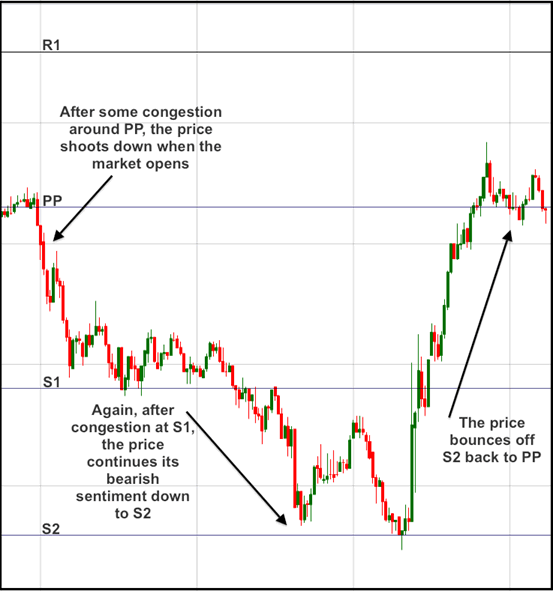
Your central pivot point (PP) is like a price magnet – the price is naturally drawn to this level. This is very important information that a pivot point trader will take advantage of.
Of course, in a strongly trending market, the price may shoot off upwards of R2 or below S2, but if there’s no news or sentiment affecting the market, we can expect to see fluctuations between S2 and R2, with a natural “pull” towards the central PP.
If the market opens above PP, it’s a bullish sign for the day’s trading. If it opens below PP, it’s a bearish sign. Many pivot point traders will use this to guide them on whether to look for buy trades or sell trades that day.
Each of the horizontal lines on our Pivot Point chart can be used to represent support or resistance – if a price approaches these lines, we should be looking for breakouts or bounce-backs, depending on whether the sentiment for the day is bullish or bearish.

As you can see, the pivot points on this chart, PP, S1 and S2 all exert a strong effect on the price as it moves towards them.
There are many trading strategies that actively use pivot points as key levels for reversals and breakouts. However, even if your trading technique does not use them to signal an entry, they can be very useful when positioning stop losses and profit targets – so well worth adding these to your charts each morning.
