The reason candlestick trading is so powerful is that – while it appears that you’re looking at some lines on a graph – you’re actually looking at raw human experience. Each tiny move on a candlestick shows people making money… and people losing money…
By recognizing a few simple candlestick patterns, you can tap into exactly what other traders are feeling at that moment.
Are they holding positions they’re desperate to offload?
Are they looking to buy?
This week I want to look at a very simple candlestick that’s fundamental to the success of Bedtime Trader, and one that’s used every day by millions of traders.
I want to unwrap what happens during that candlestick that makes it such a powerful one to trade off.
I’m afraid it’s not a pretty story…
Here’s a hammer candle that formed on the USDJPY daily charts last month…
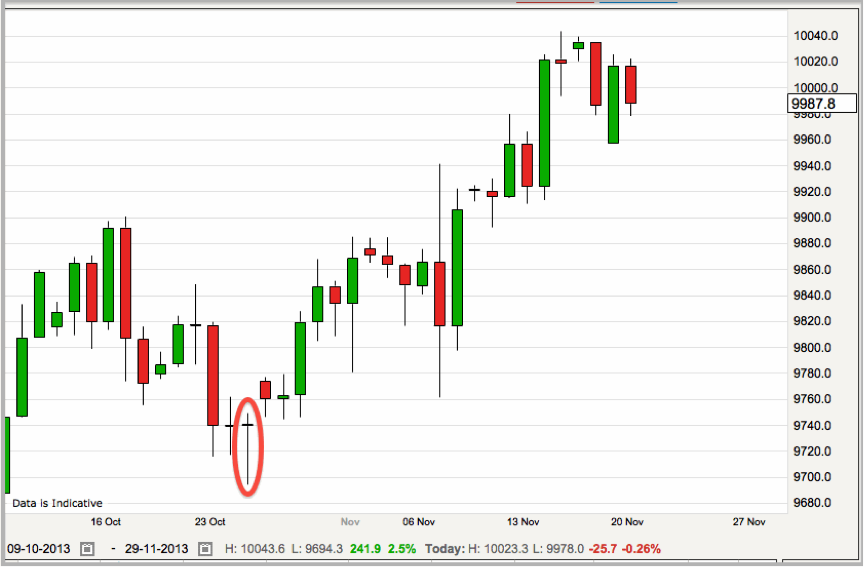
As you can see, it created a great opportunity for traders who wanted to jump in with a long position after that candle.
But what went on during that day which made this such a powerful play?
Now, I’ll zoom in to a 10-minute chart, so we can see the story behind this humble looking candle…
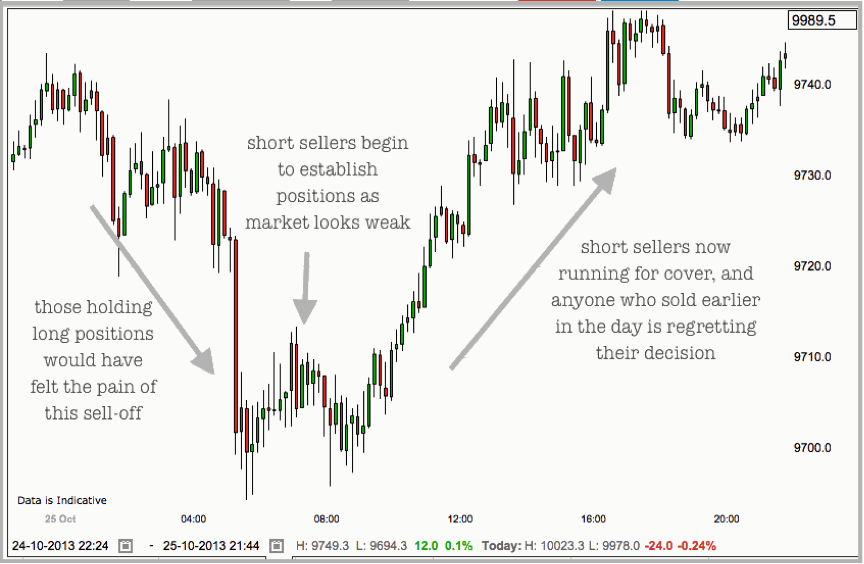
In short, it’s a story of pain… pain… and more pain.
Whether you’re a buyer or a seller.
The only people to come out of a day like this with a smile on their face are those who bought at the bottom, when the market looked weakest. A very elite group. There are plenty of sellers who are nursing their wounds; and plenty of buyers who are looking for further upward moves.
Ironically, though, it’s a painful day like this that presents the best trading opportunities going forward. Trust traders to turn a profit from other people’s pain!
More pain… more gain…
This sell-off followed by a price surge is classic hammer anatomy. And the more severe it is – the better our hammer is.
In his famous book on Japanese candlesticks, Steve Nison says: ’The longer the lower shadow, the shorter the upper shadow, the smaller the real body, the more meaningful the bullish hammer.’
This tells us that very few people came out even on this period – most of the action was frenzied buying and selling on the sudden downward and upward swing.
But at any time when we’re considering taking a trade, the question we need answer is: Who is in control? Buyers or sellers?
With a hammer candlestick we get a clear picture of buyers coming in to take control of the market. The longer the overall candlestick size, the more volume that’s implied. More volume means more buyers, and more buying power.
Of course, spotting a hammer and starting a buying frenzy is a bit like seeing two swallows and mistaking it for summer.
So, before you light up the BBQ, it’s important to look at the context of your hammer. Not all hammers are created equal – and some are best left alone.
- Look for a wave of selling ahead of the hammer.
- Look for the hammer to touch a significant area of support.
- Look for a large range on the hammer – is it bigger than the candles around it?
- Look for increased volume on the hammer candlestick.
This quick checklist gives you an idea of what to look for when trading hammers.