 The word ‘volatility’ tends to cause two very distinct reactions in traders – they either rub their hands in glee at the thought of all those lovely market moves to take advantage of… or they close their positions and run screaming for the hills!
The difference between these two types of trader… one has mastered volatility, while the other has yet to.
The trick to mastering volatility is to be prepared for it (and for a lack of it)…
Volatility is how much the market moves up and down – simple as that.
If the market is experiencing big up and down movements, then volatility is high.
If the market is moving up and down very little, then volatility is low.
An important thing to know about volatility is that it is strongly associated with falling markets. When stock markets fall, they tend to fall hard and fast. When they rise, they tend to climb slowly and steadily. Hence the saying that a bear market can lose in one day what a bull market has taken weeks to earn.
This explains why the key measure of volatility (called the VIX or Fear Index) moves in the opposite direction to the S&P index.
VIX volatility index – the long view
The VIX measures volatility across a range of options on the S&P index, and it claims to have predictive powers, measuring expected volatility for the coming 30 days.
You may have heard that this year the VIX has hit a 5½ year low. Here’s how it’s behaved over the past six months…
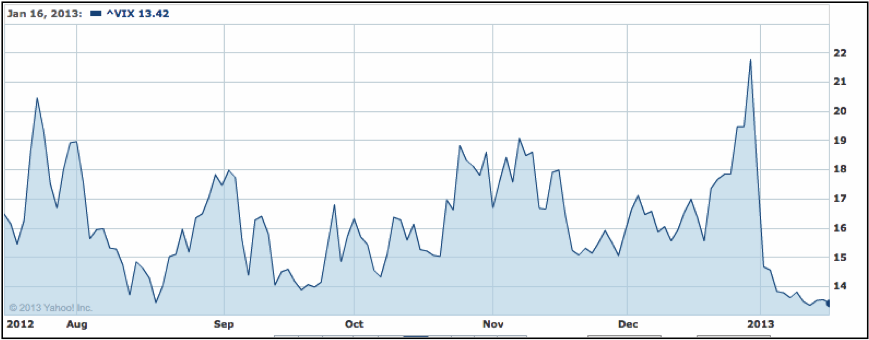
That big spike right at the end of 2012 was a result of the high-pitched screaming, hair pulling, and running for the exit that happened on the afternoon of 28 December, just as the fiscal cliff crisis reached fever pitch.
Then what?
Then the VIX fell to its lowest levels in nearly six years.
Panic over – Obama and John Boehmer have between them have managed to build a rickety structure overhanging the fiscal cliff – everything’s going to be fine!
So, if the Fear index is at an all-time low, does that mean that the outlook is rosy, and we have nothing to worry about?
Not exactly…
As I mentioned earlier, the VIX tends to move in the opposite direction to the S&P500. So, if the VIX has hit bottom, there’s only one way for it to go – up. And that means equities should be heading down.
The next image shows the S&P500 over the same period. You can see how the two have a strong reverse correlation.
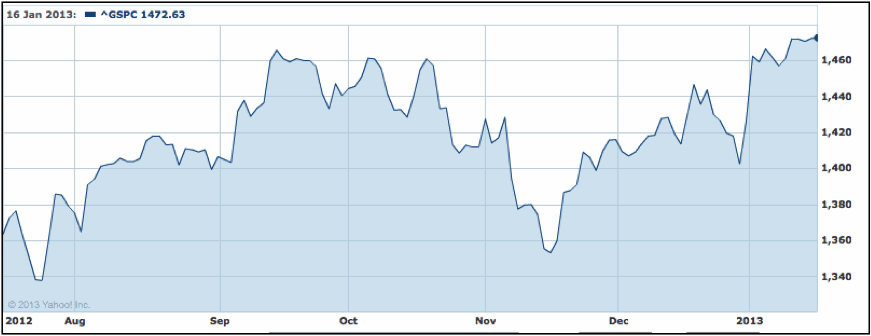
So, does a rock-bottom VIX mean that equities have topped out?
This isn’t the first time in the past year that we’ve seen long-term lows hit on the VIX. Back in August it hit a 5 year low at 13.45, and many were predicting a market top for equities.
As you can see on the chart – the S&P has continued to climb since then.
So, what’s going wrong with our VIX readings?
Many market analysts are saying that the lows we’ve been seeing on the VIX over the past year have been ‘too low’ – i.e. they aren’t an accurate gauge of market sentiment anymore.
One of the reasons for this could be the fact that traders are relying on central banks to step in and steady financial markets – so the demand for protection that the VIX traditionally measures just isn’t there.
Whatever the reasons for it, we should definitely be cautious in taking a VIX low as a sign of an equities high.
While the VIX helps to give us a big picture of overall market sentiment, it doesn’t give us up-to-the-minute data on how volatile our day-to-day trading can expect to be.
For that, we need a different tool…
Average True Range
The Average True Range (or ATR) gives us a quick, simple measure of volatility on any instrument.
It’s a basic calculation of the average trading range of the market over a set number of periods.
This chart shows the ATR over a 14-day period…
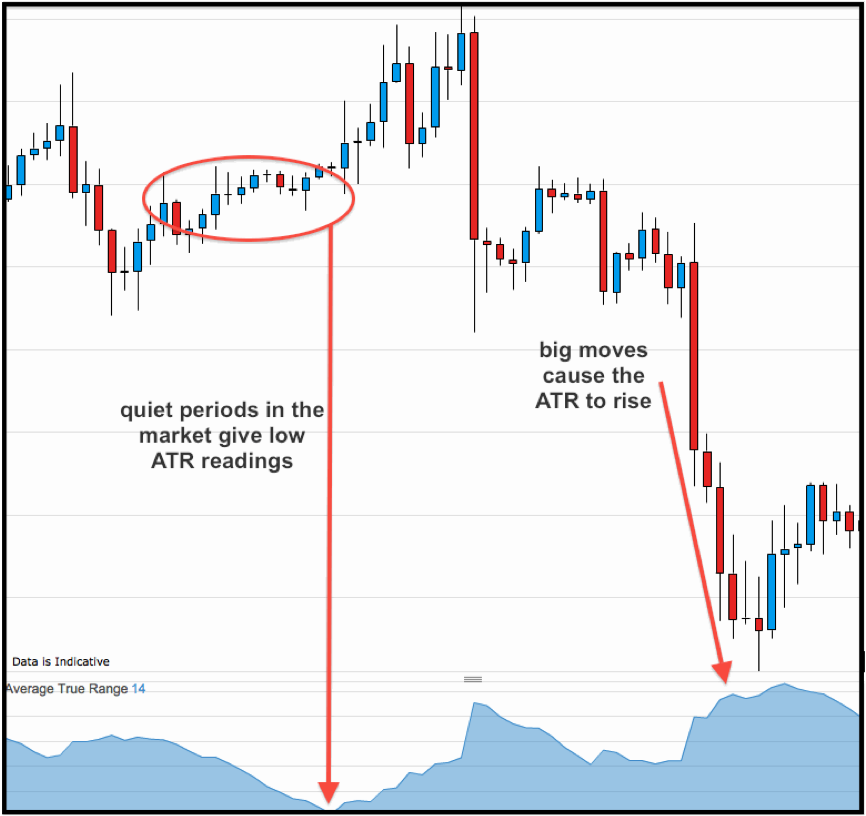
(Again, notice how these volatility spikes correspond to falling prices.)
So, how do we use this information to ensure our survival (and to thrive) in volatile markets?
Volatility affects how far we can expect the market to move during the course of our trade.
If volatility goes up… we can consider widening our targets and stops (and reducing our stakes to ensure that our risk doesn’t go up).
Volatility can be a trader’s best friend, provided, you can be prepared for it (or for a lack of it), and are ready to adapt.
In the next seven days…
Next week, global leaders, academics, business heads and hangers on will be packing their scarves and gloves and heading off to the swanky Swiss ski resort of Davos.
There should be no shortage of things to talk about at the World Economic Forum, with the ongoing Euro debt crisis… the US fiscal cliff… and slow global growth.
Elsewhere, Monday sees a statement from the Bank of Japan, which is widely expected to add more economic stimulus.
Whether the Bank of England takes the same route may be clearer after the release of minutes on Wednesday.
The calendar also shows the German ZEW survey on Monday; US homes sales on Tuesday; UK employment data on Wednesday; PMI releases from Europe and the US on Thursday; and on Friday we have the German IFO business climate survey and preliminary UK GDP figures.