 One of the technical signals in constant use in financial trading is the parabolic SAR, now while you really don’t need to understand what parabolic SARs do to, a few of my readers have asked me just what they are.
What are parabolic SAR’s?
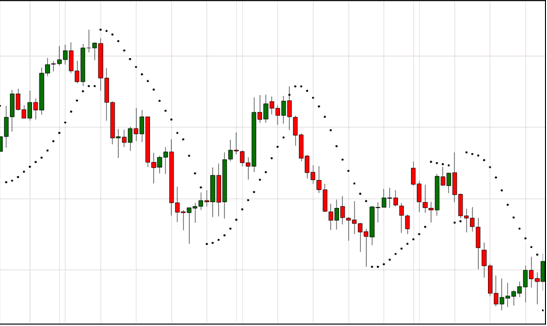
If you’ve not come across a parabolic SAR before, it looks like this …

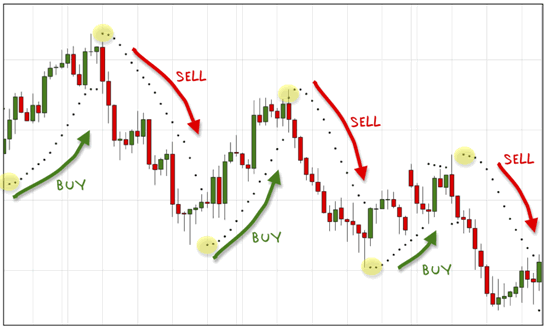
And it’s one of the easiest trading signals to read. If the dot switches to below the price, we’ll anticipate an uptrend. If the dot switches to above the price, we’ll expect downward pressure on the price.
Like this …

The calculation behind the SAR is less simple (it’s based around an “acceleration factor” with a few “if/then” variables thrown in) but fortunately we don’t have to worry about that, because, whether we’re using the UFXP software or not, our charting package will take care of all the calculations for us.
All we have to do is watch for the little dots to switch sides of the price – when they go above the price, we have a sell signal; when they go below the price, we have a buy signal.
If you look at the example above, you might be thinking that this simple indicator is the answer to all your trading problems. But, like most technical indicators, it has its weaknesses …
Trending markets
Many traders who develop their own strategies latch on to the parabolic SAR, and have a great deal of success with it while markets are trending.
In fact, they can become a bit evangelical about their SARs, boasting huge returns.
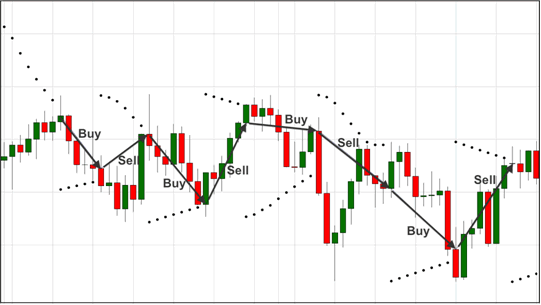
However, when market conditions change, and they start moving sideways or getting very choppy, the parabolic indicator really struggles, and can give lots of false signals.
Here’s an example of what can go wrong for a trader relying solely on SARs, when the market gets choppy …

Suddenly their fail-proof indicator is giving them false signal after false signal!
But that doesn’t mean that we should be throwing parabolic SARs out with the bathwater.
Even Welles Wilder, the man who invented the parabolic SAR back in 1978, advocated using it in conjunction with other signals for confirmation.
That’s why it just doesn’t work as a signal on its own – it needs checks and balances to tell you whether this really is a change of direction – or whether we’re just going into some sideways movement.
Over the years, I’ve seen parabolic SARs applied in many, many ways, and combined with other technical indicators or with candlestick patterns and if you want to build them into your own trading strategy, parabolic SARs are available at the click of a button on most trading platforms.
