 At heart I am a counter-trend trader. Going with the crowd doesn’t come naturally to me whether it’s the phone I use, the choice of holidays taken or buying when everyone is selling.
However, you can’t always be a counter-trend trader and as the recent sell-off showed, buying the dips can be painful if you catch a few knives on the way down.
There are two important components of successful counter-trend trading:
1) Managing risk and handling losses.
2) Knowing when conditions are no longer in your favour.
This article is in two parts. The first part looks at ways that you can reduce risk on trade entry for any strategy, especially counter-trend trading by stepping into trades.
The second part looks at methods you can use to spot when market conditions no longer suit the type of trading method you are using.
Part 1: Taking Brave Trades One Step at a Time
Even at the best of times, counter-trend trading can be a difficult technique to master. Whether it’s on a 5 minute forex chart or the daily charts on the stock markets, buying into a sell-off can reap rich rewards if you get your timing right.
However, these methods can sometimes feel the heat when markets continue to be overbought or oversold for a number of minutes/days before reversing or pausing for a breath. Usually this happens just at the point you give up the ghost and pull out of the trade and cut your losses.
The recent market turmoil has left many counter- trend traders with burnt fingers, especially when trading pullbacks in a market that has not been pulling back as it used to! Such times can be a real test of your discipline as you may be tempted to skip a trade based on fear only to miss what might have been your biggest winner of the year.
The psychological toll can often lead to trading errors when you delay pulling the trigger.
In this article I’m going to show you one way that you can manage risk and trader psychology by stepping into your trades. I’ve focused on an end of day trading strategy, but in my research I’ve found virtually identical results from intraday counter-trend strategies.
Stepping in
One example of a counter-trade trading strategy is the use of a short-term trading indicator such as the RSI (2 periods) or the DVB. A version of this indicator is available within MetaTrader as a custom indicator which can be downloaded via the What Really Profits resources page: http://tinyurl.com/6GLE7UG DVB Signal (also known as DV-2) = Long below 0.5, short above 0.5
Given the potential for this to happen, could you improve your risk adjusted returns by “stepping in” to your positions? And, does the use of stepping in decrease risk enough to compensate for a reduction in performance?
Stepping defined
Before you do anything you must determine your total position size on the trade. This might be 2% of your account if using a tight stop and leverage or a full position if trading without stops (see this month’s article on the pros and cons of trading stops).
For this example, let’s assume that the total exposure you’re prepared to risk on a trade is £100. In regular trading you might fully expose yourself to a trade of this size right away, but when scaling, you enter the trade in stages.
Using the scaling method, you divide your total exposure into “X” number of units and then apply a new unit for every day that the underlying signal remains the same (e.g. you continue to get “buy” signals over multiple days). Let’s call this “Time Based Stepping”.
This is not the same as the Martingale/loss recovery staking, employed by certain casino players or forex robots. This dangerous form of staking involves doubling up on your position after a losing bet/ trade. This reduces your average cost of entry, but your liability is potentially unlimited. As the saying goes “markets can remain irrational longer than you can remain solvent”. Just ask rogue traders such as Jerome Kerviel or Nick Leeson.
Stepping does not add more liability with each position, instead you are dividing your total position into units and then applying those units until you reach your maximum unit count or the trade signal reverses.
For example, you may divide your position into 3
units. If trading with a total risk on the trade of
£100, this would mean three equal units of £33.33. Day 1 – Long signal. Enter trade with 1/3 unit size. Total position = 1/3 full potential position size.
£33.33 committed.
Day 2 – Second long signal. Enter trade with another 1/3 unit size.
Total position = 2/3 full potential position size. £66.66 committed.
Day 3 – Exit signal. Exit the long positions. To be clear, you never exceed a full 100% invested
(or whatever your maximum leverage target is).
Thus, if the long signal envisioned above continued for a total of five days, you would have added one more position to bring you up to a trade liability of £100, but no more.
The pros and cons of stepping
When counter-trend trading you’ll rarely time the bounce to perfection. In an ideal world you’ll time the exact bottom of the move so you bounce from the first bar of entry. If this happened on every trade, scaling would reduce your profits because you would only be at 1/3 or 1/2 trade size on your winning trades.
But if you can get your trades to win on the very first bar of entry every single time, you’d be one of the greatest traders in the world!
You’ll note in the example above, we never reached our full trade size of £100. The advantage of scaling is that you can give your trades time to mature while reducing potential risk on your initial entry by not going all in straight away.
Stepping in practice
Let show a real-life example of stepping into a trade.
The market is the S&P 500 with the DVB short- term indicator displayed beneath. We’re going long on an indicator reading below 50 (0.5) and short on an indicator reading above 50 (0.5).
The chart shows four consecutive buy signals at the close but the market continued to go lower.
S&P 500 with DVB indicator February 2011:
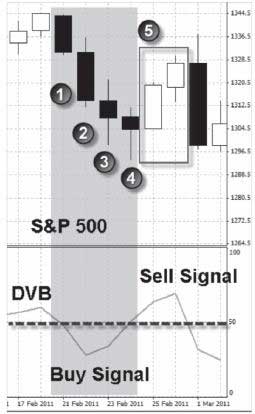
Day 1: February 21st. After a successful sell signal the previous night, with the DVB below 50 you are given a signal to go long at 1331.10.
Day 2: February 22nd. The buy signal was unsuccessful with the market dropping further. The market closed at 1314.30 with the DVB below 50 and triggering a follow on buy signal.
Day 3: February 23rd. The buy signals to date have been unsuccessful. The market closes lower at 1308.30 triggering another follow on buy signal as the DVB is still below 50.
Day 4: February 24th. The market closes lower again at 1304.30, triggering another follow on buy signal.
Day 5: February 25th. Relief at last, the market rallies and closes at 1319.6, closing the long trades and opening a new short trade as the DVB is above 50.
Results from a single trade
Let’s say your total risk on this trade is £1,000 with a 1% move in the market representing a 1% move in your account balance. If you placed a single trade and held it through all the buy signals, your results would have been as follows:
Buy at 1331.10 day 1. Sell at 1319.60 day 5.
Loss of 0.86% in total on the trade. Loss of £8.64 on your £1,000 risked. Results from stepping in
Let’s say your total risk on this trade is £1,000 with a 1% move in the market representing a 1% move in your account balance. You have split your total risk into four equal units which means that you apply four trades risking £250 until four units are applied and your £1,000 risk limit is reached.
Effectively instead of placing one single trade of £1,000, you are placing four trades of £250:
Day 1: Buy at 1331.10. Sell day 5 at 1319.60. -0.86% on trade risking £250. -£2.16 on this trade unit.
Day 2: Buy at 1308.30. Sell day 5 at 1319.60. 0.40% on trade risking £250. +£1.01 on this trade unit.
Day 3: Buy at 1304.30. Sell day 5 at 1319.60. +0.86% on trade risking £250. +£2.16 on this trade unit.
Day 4: Buy at 1319.60. Sell day 5 at 1319.60. +1.17% on trade risking £250. +£2.93 on this trade unit.
Total return across the four trade units = +£3.94.
By stepping into the trade in units rather than entering all in one go, you have managed to turn a loss-making trade into a winning one.
Note: To stress again, you always set your maximum risk level in advance of a trade being placed and never exceed it. If the trade had continued to lose, you would NOT have added more units once you had reached your maximum exposure.
Stepping trading results compared
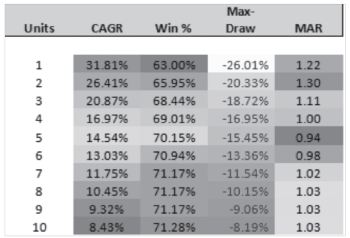
To better show the impact of “stepping” on trading your trading returns, I have tested a simple strategy with various stepping units applied for comparison.
The simple strategy uses the DVB indicator mentioned earlier. Going long on a reading below 50 and short on a reading above 50.
Testing on the S&P 500 tracking ETF SPY from July 6th 2001 to July 11th 2011.
I have performed similar tests on intraday day trading systems for stock markets and forex markets and while they do vary depending on the system, the general conclusions remain the same. So these results should have some bearing whether you are trading the GBP/USD on 5 minute charts or the stock market trading daily charts.
Stepping In: Reducing risk – Increasing profits?
Terminology:
Units: The number of units the trade is divided into when stepping in stages. 1 is the baseline scenario with no stepping involved where 1 unit = 100% position size on day one (baseline). 2 units means your max trade risk is divided into two trades which are applied if you get consecutive signals in the same direction. 3 units means you split your position into three and apply them on consecutive signals, etc.
CAGR = Compound average annual growth rate. Win % = Percentage of winning trades.
Max Draw = Worst case peak to trough loss on account balance experienced.
MAR = Max Adverse Reaction. CAGR divided by Max Draw. The higher the number, the better the ratio. Anything better than 1.00 is considered excellent. Ideally, you want your biggest loss to be less than your annual growth rate, which would give you a MAR greater than 1.0.
For example, the MAR of buy and hold investing the FTSE 100 since 2001 is a paltry 0.05. The Compound Annual Growth Rate is 2.87%, but the Max Draw down is -55.119%, The drawdown is massive compared to the meagre CAGR.
Here are the results from trading the DVB method with various units used for stepping:
Interpretation:
In raw Compound Annual Growth Rate terms, simply using one unit for your trades has historically provided the best returns. However, this does come at a cost. You are fully exposed to any trades that move against you over multiple days.
While the CAGR is the highest for the baseline, so is the Max Draw.
The key metric here is the MAR which is 1.22 for the baseline scenario.
Using two units instead of one does decrease the CAGR, but because the Max Draw also decreases by a greater magnitude, it does appear that using two units may represent a greater risk-reward.
The benefits of scaling are not exponential though as the MAR remains fairly set at around 1.03 as more units are added. As you divide your trade into ever greater chunks, you reduce your drawdown risk, but your annual returns reduce as well. There is an obvious reason for this which is that if you are applying 10 units and most of your trades close within three days, then your trades will on average be making 1/3rd less than a full-size trade.
One thing you may have noticed though is how scaling increases your strike rate. As you spread your risk across an increasing number of units, you increase your chance of making a profit overall from the first signal to the last.
Trading psychology – taking brave trades one step at a time
Beyond raw numbers, there are other potential benefits to using a stepping strategy – managing trading psychology. Some of the best returns from counter-trend trading strategies have come at points where the market is highly volatile. At these points it would be more difficult to implement your trading signals in practice unless you have learned to manage your trading fears in the face of large potential losses, or have implemented an environment filter as discussed in the previous article.
This is where trading theory meets trading reality. There are always two aspects to any trading system:
1) The trading signals
2) Your practical and psychological ability to pull the trigger on those signals,which take advantage of fear and greed by design.
Stepping into your trades may reduce the personal impact of entering a trade that could run away from you right away and mitigate possible early losses that may otherwise shake you out of your trade. By dividing your position into units you may in effect reduce so-called “tail risk” as extreme moves against you will be watered down and your average cost of entry reduced. In addition to reducing the size of potential drawdown, sequencing may reduce expected losing sequences, which may just help you stay the course during an especially choppy period for your trading strategy.
The bottom line
Stepping into your trades is not a magic bullet that will transform a poor system into a highly profitable one. What it may do is help you spread the risk on that trade by reducing your cost of entry.
There is a nice by-product of stepping – that of increasing your strike rate which I’m sure would appeal to many beginner traders. It is also a good way to keep your trading discipline on trading signals in volatile trading environments.
The major downside of stepping is the increased cost per trade either in brokerage fees or increased spread, but the peace of mind and experience gained from remaining in the market may more than make up for it.
The exact number of units to apply is up to you and will depend on the characteristics of the system you are trading. As a general rule of thumb, the quicker it finds winners, the less scaling you may want to apply and vice versa.
Part 2: Trading Systems – When to Fold ‘em When to Hold ‘em
While most people will have heard of legendary investors such as Warren Buffett or George Soros, there is another financial billionaire who has a track record on a par with these giants, yet few have ever heard of him.
Described as the “world’s smartest billionaire”, this mathematical genius shuns the limelight to such an extent that it would be easy to miss the fact that he is the 74th richest person in the world with net worth thought to be in excess of of $10.6 billion.
The trader is Jim Simsons, head of the highly secretive Renaissance Technologies. In 2009, Renaissance recently scored as the most profitable hedge fund in the US, piling up profits of $1,100,000 in 2009.
With Renaissance understandably guarding its secrets very closely, it’s very hard to know just how Renaissance does it. Over the years small snippets of information have emerged though. The main thing appears to be the use of scientists over Wall Street professionals or MBA professionals who may not be able to look at markets from an outsiders perspective as Simons’ boffins are able to.
Another hint that has emerged over the years is the flexibility that Renaissance applies to their trading systems. Renaissance scours the market for repeatable patterns that could be translated into profitable trading systems. This is only the tip of the iceberg though. Their real genius is reportedly not their systems, but their ability to know what systems to apply in different market conditions and when something has gone off the boil.
Financial markets are constantly evolving, with trading patterns shifting from slow and steady upwards grinds pre 2008 to wild thrashings that made financial markets appear to be acting at the behest of a baby randomly pounding the keyboard.
In this shifting environment, it’s no surprise that simple trading systems have an inherent shelf life. Repeatable patterns appear within financial markets, offering substantial rewards for those who can spot them early enough. The real skill is not in spotting them, but understanding them well enough to know when and how to apply them in context. Specifically, this means, the ability to know:
A) What conditions best suit that particular system B) When that system is losing its potency
In the many years that I have been trading and during the time I have been writing What Really Profits, I have seen many trading systems come and go.
In that time I have been able to spot a pattern in how well particular products might fare. The best offerings I’ve seen are those where the vendor has a deep understanding of what makes a particular strategy tick – what sort of market conditions that a strategy favours so they can quickly spot when conditions do and don’t suit a particular system.
The worst kind of systems are those where a vendor appears to offer little understanding of the context in which a system best flourishes.
So if you intend to trade a systematic trading strategy with fairly rigid rules and you know that every trading system has a shelf life to some degree or another, what are you to do?
To help answer this question, I refer to a blog post from this month’s interviewee Jeff Pietsch of etfrewind.com
The main highlights from this post for me are these three suggestions:
1. Know what environment you are trading in (reverting/trending).
Does the system perform especially well when markets are choppy and relatively poorly when markets are more trend following?
2. Trading methods themselves revert.
Some trading systems are consistent with steady winners, while some equally profitable systems can be more volatile. Understanding what is “normal” for a trading system can help you stay the course or drop dead wood.
3. Track your methodology’s equity curve like it was a stock.
Sometimes tracking the progress of your trading account can tell you more about the health of your trading system than the performance of the system itself.
These suggestions all boil down to one simple concept – know your system and know your market.
When you better understand your trading system you have the ability to be flexible in your application of it.
1) Switch a trading strategy entirely on or off depending on trading conditions.
2) Reduce or increase position size depending on market conditions and system progress.
If you have access to back-testing software, I thoroughly recommend testing a trading strategy not on the basis of performance, but to spot what else is going on around any particular times of under or over performance.
Even if you have access to back-testing software, this only goes so far though. The best results come from seeing how your trading strategy performs live day in, day out. Think of a trading strategy as being like a good friend or relative. There might be quirks or subtle things that you are able to spot that others can’t. For example, you might know when someone is best left to themselves or if they have some good news they are trying to hide.
By getting to know a market and getting to know a trading system, you can spot the subtle signals that will help you switch on or switch off a system.
Abnormal markets
To put some of these ideas into practice, one filter I have been applying lately is to identify when markets are behaving abnormally.
My favoured short-term indicator when day trading financial markets has been the DVB indicator, but in early August I noticed that it was entering dangerous territory. As with the article on Stepping In, I have performed similar research on shorter-term day trading systems on a variety of markets including The DVB indicator performs best in choppy, counter-trend trading conditions, but there are times when markets become too choppy with violent moves that are so big they do not reverse. You only have to look at charts of most stock market indices in August to see what I mean.
Thankfully, I have been applying an abnormal market filter, an idea first mooted by Michael of Marketsci.com. If the market is behaving abnormally, then it may pay to reduce position size or stop trading the system entirely.
There are many ways to measure an abnormal market, but I’ve done this via a standard deviation filter. A simple way of applying this is to use Bollinger bands set to 60 periods with 2.50 deviations. If the market is more than 2.50 standard deviations below the average then you have a potentially abnormal and dangerous market.
My rules were more simplistic: If the market falls below the longer-term Bollinger band, stop trading- strategies in that market.
Here’s a chart showing the S&P 500 with the abnormal market conditions applied:
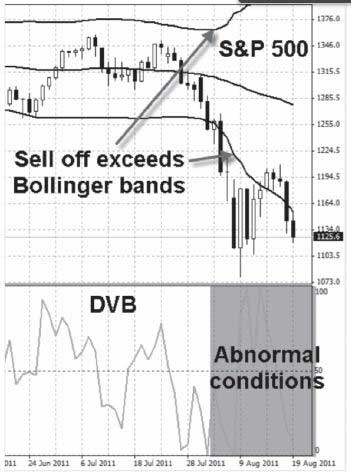
The Bollinger band lines are available as standard in most charting applications. As mentioned in the previous article, the DVB indicator can be downloaded via the What Really Profits resources page http://tinyurl.com/6GLE7UG
Below, you can see the impact of applying the abnormal market filter to the system in the current market.
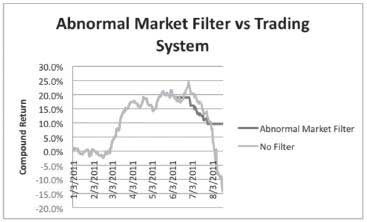
The light grey line shows the tail off in system performance and the impact it would have had on returns in 2011. The dark line shows the retained performance with the abnormal market filter applied. At the time of writing, the abnormal market filter would have helped you to keep the gains of 10% generated in 2011, while the trading system applied blindly would now be down 15% for the year as markets continue to be too volatile.
Similar filters could be applied to your intraday markets for day trading, though you may need to adjust the Bollinger periods. In conclusion, understanding the type of market you are currently experiencing and whether that is good news or bad news for your trading system can help you reduce the risk of blowout.
When a trading system falls through the trap door
Looking at market behaviour is just one way you can monitor system performance. Another more obvious way is to examine the equity curve of profits from following the trading system you are using. In trading parlance, your equity curve is a chart showing the cumulative ups and downs of your profit and loss from your trading.
Stopping trading a system because it is going through a rough patch is harder than it sounds though. As outlined at the start of the article, different trading systems will have different rhythms. A system with a high strike rate but low average gain per trade will have a more regular equity curve than a lower strike rate, big gain type system. Therefore you need to apply some tolerance that takes into account the sort of ups and downs you can expect when a system is performing well, if you are to spot when it is not performing well.
There are numerous ways you could do this, but I’ll present a couple of options here. Again, this could apply to any trading system (day trading or longer-term trading), but I’ll use the DVB method for this example once again.
Abnormal equity curve
If you are reasonably Excel savvy, I recommend exporting your trading profit and loss for different trading systems to Excel so you can chart them as if it was a financial market itself. If you need a little help doing this, feel free to contact me on [email protected]
What I then do is apply a Bollinger band, not to the market, but to my equity curve. This means applying a line to my equity that is 1.5 standard deviations below the 60 period average of my account equity for the different strategies I track.
This line acts as a safety trigger. If the equity curve drops below this safety trigger I then either stop trading the system or reduce exposure.
Here’s how it worked recently with the DVB indicator:

We can see that recently the equity curve dropped below the safety trigger, giving an early warning signal (actually before the abnormal market filter did).
It doesn’t always get it right and can often signal too early, but what it does tend to do is reduce volatility in trading returns.
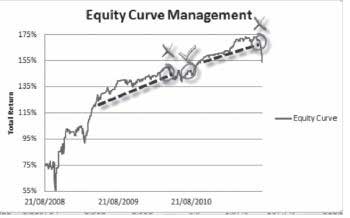
Another relatively simple filter is to “eyeball” a chart of your account balance and draw manual trend lines on it as I have done below. If your equity curve drops below the trend lines, then it may be time to stop trading the system.
The bottom line
I hope these articles provide some ideas to help you manage your trading systems better. Pure quantitative rule-based trading systems are not for everyone, but if you do wish to trade successfully in this field, then managing your activities is a vital way to stay ahead of the game.
This can be done by either keeping a close eye on market conditions, the performance of systems you are trading, or ideally both. Trading system management is an area that often goes unreported, which is a shame because in my experience it is just as, if not more important, than finding the systems in the first place.