Trading on Forex Market Trends
Systems based around short-term pull-backs have been very successful over the last few years as stock markets flip between short-term overbought and short-term oversold on a regular basis.
One extremely successful strategy has been to use an indicator called the DVB to spot these opportunities. The DVB is a non-standard indicator and you can find a version of this indicator for use with MetaTrader (and Smart Live spread betting should you wish) on our January downloads page.
If you do not wish to use this indicator or cannot use it in your charting platform, then the RSI indicator set to 2 periods performs a very similar function and is available on virtually all charting platforms.
The chart below shows some typical trading set- ups using a short-term pull-back strategy. The market is the S&P 500 stock market index with the DVB (DV2), indicator displayed below it.
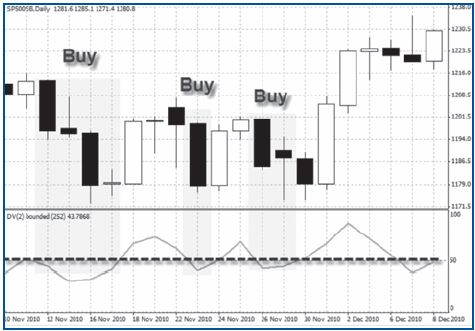
The typical rule is to buy on a DVB score below 50 and sell on a DVB score above 50 (the dotted line). In the chart above I’ve marked a few buy signals where the DVB drops below 50.
Following this very simple strategy would have produced phenomenal returns since 2006 as the chart below shows. Ignoring trading frictions, had you applied this strategy back in 2006 until present, £1,000 would now be over £7,000. There are two main problems with this however.
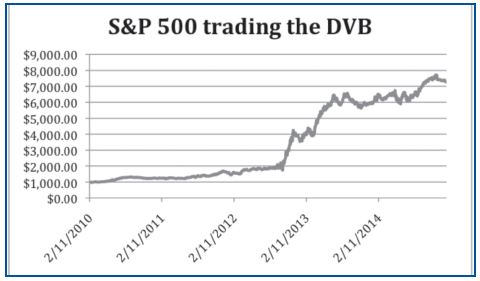
1) What if the stock market goes through a prolonged period where it simply does not pull back, but instead continues to drift higher with very shallow pullbacks? This has happened recently with the S&P 500 travelling higher throughout the whole of December meaning any signals to go short have been consistently loss making. In these trend-following periods, the DVB or RS2 can remain above 50 for a long time giving continuous sell signals, but building up losses on your short trades.
2) Forex is a very trendy market to trade, so what would be your best option here? You actually would have made a small profit trading the opposite rules described above for most forex pairs over the last few years (i.e. buying on high readings, not selling), but simply doing the opposite isn’t enough to make it worthwhile, neither is it very consistent.
There are ways around the first problem such as paying close attention to the trading calendar. By using seasonality to modify when you go short, you can side step a number of losing trades. We’re in the middle of a season with positive seasonality and recognising this has helped to cut down the number of losing trades considerably.
Unfortunately, Foreign exchange (Forex) is appears to be a different kettle of fish entirely and is certainly more prone to trend following. In my experience short-term indicators such as RS2 don’t work even if you try to apply numerous filters.
After many months of testing I have found something with real potential though. Instead of trading based on a single day’s reading, I wondered what would happen if you traded the average reading of a short term indicator on the EUR/ USD.
Below you can see a chart of the EUR/ USD with the black DVB indicator line below it, oscillating between 0 and 100. The grey line is the 20 period average of the DVB.
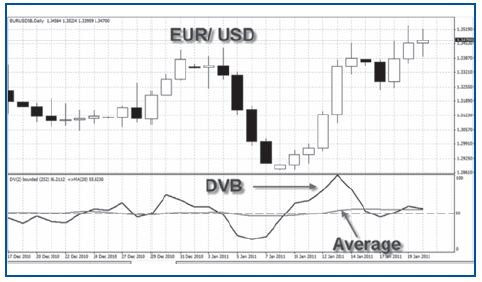
At the time of writing, the Average is above 50, indicating strength in the EUR/ USD.
In the chart below I removed the DVB to just show the average.
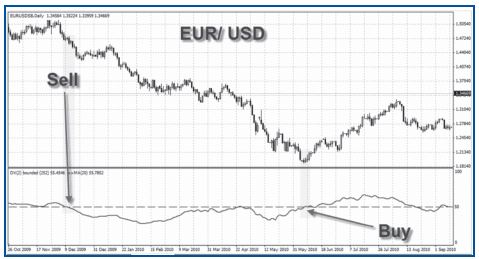
You can see that the average crossed below 50 around December 2009 and kept you short until May 2010, very close to the actual bottom for that period.
I tested the performance of a strategy using this average DVB on the EUR/USD going back to 2000.
The rules for this very simple strategy were as follows:
Buy the EUR/USD when the 20 period average of the DVB is above 0.5.
Sell(short) the EUR/USD when the 20 period average of the DVB is below 0.5.
No commission or spread was accounted for.
EUR/USD spot price since 2000
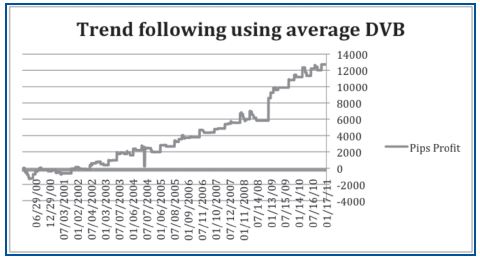
Since 2000, the average DVB trend trading system has made over 12,000 pips. Had you bought a position on the EUR/USD and held it over the same period, you would have made just 3,000 pips and the ride would have been nowhere near as smooth.
The system has a strike rate of just over 50%, but the average winner is almost double the average loser. The average trade nets 70 pips with a typical winner being in the region of 200-300 pips.
As you can see from the graph, the total profits aren’t reliant on a single big winner, but they are certainly helped by one trade that caught the long wave down in 2008. That alone netted around 2,500 pips.
At just 10p per point, the system would have netted over £1,200 since 2000, while 50p per point would have made £6,000.
Money management
With trend following like this, you would expect there to be some big losers as well and you’d be right. The average loser is around 131 pips with the worst losing streak lasting around 1,000 pips.
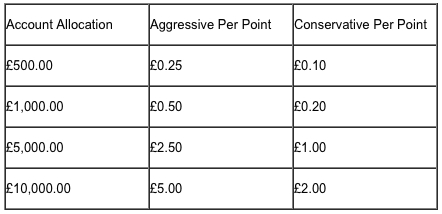
The system outlined is very basic and at present there are no suggested take profit points or stop losses. Over the next few months I shall hopefully be sharing some ideas for take profit levels and stop losses based around the basic strategy, but if you wished to trade it as it is, here are my suggested minimum per point values for spread betting.
For an aggressive trader with high risk, divide your allocated trading pot by 2,000. For a more conservative approach, divide your pot buy 5,000.
For example, if you have £1,000 and want to take an aggressive approach, divide this by 2,000 to get £0.50p per point. A conservative approach for the same amount would mean £1,000 divided by 5,000 making £0.20p per point.
Short-term trading
Not everyone is comfortable or interested in medium to long-term trend trading and if this is the case with you, then the average DVB could still be of use.
For starters, you could use the average as an intraday directional filter. In the past I have found that morning breakout systems perform much better in the long run if the breakout occurs in the direction of the longer-term trend (assuming you’re not just scalping). Trading in the direction indicated by the average DVB of making smaller trades if not could be a way of using it.
Of course, the average is not foolproof and is slow to adapt to any trend changes. What it does well is identify the right bias most of the time. Trading in line with the average DVB means you get the day’s direction right 51% of the time for both long and short trades. It’s only a small advantage, but small advantages add up in the long run.
Another way to use the average DVB is to trade short-term pullbacks against the direction indicated by the average.
For example:
Buy at the close if the DVB indicator (not average) drops below 45, but the average is above 50. Close trade or make no trade if the DVB rises above 50 at the close.
Sell at the close. Go short if the DVB indicator (not average) rises above 55, but the average is below 50. Close trade or make no trade if the DVB drops below 55 at the close.
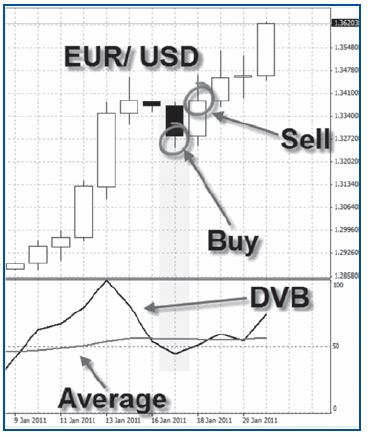
The screenshot above shows the strategy in action. The black DVB line drops below 45 for a day while the average is still above 50. Buying at the close of that day and holding until the close of the next when the DVB rebounded to above 50 would have netted 108 pips.
This strategy has a 57% strike rate, meaning it calls the next day’s direction correctly 57 times out of 100. It performs nearly as well as the trend- following method, but from less than a quarter of the number of days spent in the market.
This basic strategy is nothing more complex than a “buy the dips” idea. What it does well is to identify the strong trend correctly and when the price has pulled back enough.
The very basic strategy outlined above could no doubt be improved with an appreciation of support and resistance.
Getting the DVB and setting up your charts
You can find the DVB indicator for use with MetaTrader here.
You’ll also find instructions on how to create the average DVB by simply dragging the moving average indicator onto your charts.
The bottom line
The EUR/USD is a market highly prone to trend following, with each day more likely than any other market to follow the direction set by the medium- term trend. I also tested this idea on the dollar index, which is a trade weighted index of the US dollar itself in isolation. I found that the average DVB performed even better, perhaps indicating that it is the US dollar which is at the epicentre of trend following for the EUR/ USD pair, though the euro no doubt plays a good supporting role.
Ultimately, this method may be best used as a trend filter, with the profitable buy and sell strategy providing some evidence of its usefulness.