 Okay, I’ve opened a can of worms with this one.
What constitutes a trend?
It’s a question that will generate 100 different responses from 100 different traders.
But, having spent months in a wilderness of sideways, wildly zigzagging markets, we’re now seeing plenty of long-term trends building up on our charts, so, even if you don’t agree with my method, you really need to develop a system for spotting trends, so that you can take advantage of the huge moves (and profits) that a trending market can offer us.
And, of course, once we’ve established our trends, we can get some of our old trend-specific indicators down from the shelf and dust them off – stuff like moving average crossovers … parabolic SARs …
What is a trend?
Well, if you look up “trend” in your trader’s dictionary, chances are you’ll come across something along the lines of …
An uptrend is characterized by a series of higher highs and higher lows.
And a downtrend is characterized by a series of lower highs and lower lows.
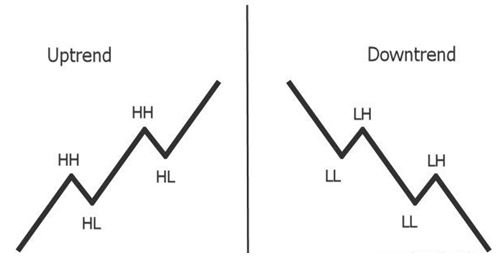
All very nice and tidy.
But if all charts looked like this, my name would be Warren Buffet.
The market is estimated to be trending only 30% of the time. The rest of the time, it’s moving sideways and generally keeping us guessing.
So, trading the trend is not as simple as it sounds.
Finding the big picture
Let’s take a look at the bull run we’ve had on the FTSE since November last year …
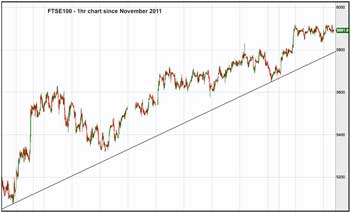
There’s no doubt that we’ve got an uptrend here, but the market remains very choppy, with plenty of scope for losing money on long positions, as stops get hit with these wild swings.
And zooming in …
If we focus in on one area of this chart – say the last couple of weeks of January …
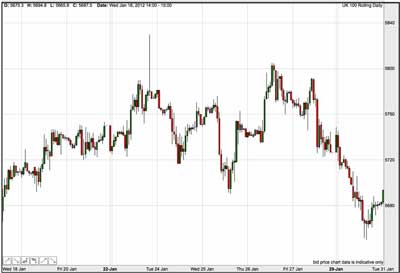
Now, what happened to our trend?
It seems to have evaporated.
Clearly, we need something that’ll help us pick out trends in more detail.
Some people will use a MACD … some people will use an ADX …
But for me, a great place to start is a long-term moving average. So here’s what it looks like with a 200MA drawn in …
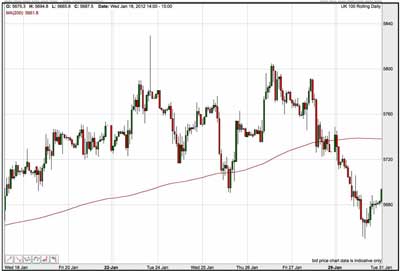
When it comes to weapons in your trading arsenal, a 200-period moving average is rather like an aircraft carrier. It changes direction very slowly, and with great difficulty, but when it starts moving in a new direction, you should always take notice.
When the price is above the 200MA, the trend is up. When the price is below the 200MA, the trend is down.
By putting this on our FTSE chart, it reminds us that the overall trend is up. And it may filter out a few losing trades, but it hasn’t really honed in on the all-important trending parts of our chart.
To help find those, I’ll add another couple of moving averages …
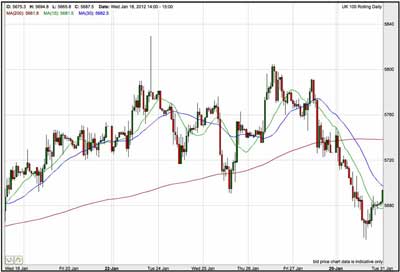
Here I’ve added a 15-period moving average (in green) and 30-period moving average (in blue). For an uptrend, we want our 15MA to be above our 30MA. For a downtrend, we want our 30MA to be above the 15MA.
So, if our price is above the 200MA, and the 15MA is above the 30MA – we should be trending upwards.
It’s not infallible (what indicator is?), but it does help us to filter out some of those violent price corrections …
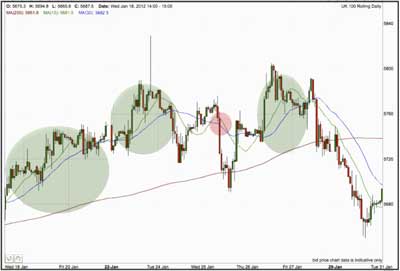
Here the green areas show where it’s successfully predicted an uptrend, and the red area is where the indicator got it wrong.
So, how do we use this information?
Please bear in mind that this is NOT a trading strategy – these aren’t buy and sell signals.
This indicator is designed to tell you when the market is trending, which in turn, can give you important information on the approach you take to the market.
Most trading strategies are best suited to certain market conditions – range-bound markets or trending markets.
So, if your information is telling you that the market is trending – it should affect the way you apply your other trading tools.
For example, if markets are ranging, then a range-based trade might involve watching overbought and oversold signals, and shorting at resistance or going long at support.
If markets are trending, however, you could trade only in the direction of the trend by looking for breakout trades.
Whilst it would be nice to think that one trading solution would fit all market conditions – unfortunately, things aren’t that simple. So, by getting a little bit more information about the way the markets are behaving, we should, as traders be able to act a little bit more wisely – and boost our profits.