Years ago, when a mobile phone smaller than a house brick was considered the height of technology, trading was done a little differently.
In the days of open outcry trading pits, trading was as much a physical as well as a mental skill. It was dog eat dog on the trading floor as floor traders battled to outdo each other without the aid of fancy live trading charts or Blackberries.
During this time traders lived on their wits, with decisions having to be made based on quick mental arithmetic.
One favourite tool for the floor traders was the use of pivot points, lines based on the previous day’s trading activity which gave a quick mental picture of likely support and resistance points throughout the day. As these pivot points were also used by other floor traders, the levels became a self-fulfilling prophecy, increasing their usefulness.
Nowadays there are very few open outcry trading floors remaining, so traders don’t have to rely on having the daily levels in their heads every day. However, pivot points are still a widely-used trading tool, even in today’s computer generation.
Pivot points
Traditional pivot points are made up of 5 lines with seven used for extended pivots.
The core of a pivot point strategy is the pivot line itself.
This is a relatively simple calculation based on the previous day’s trading range.
Pivot point = (High + Close + Low) /3 There are then three resistance lines above the pivot at an increasing distance away from it and three support lines, also at an increasing distance from the central line. Most charting packages come with pivot points, but not all will display R3 and S3.
• Resistance 3 (R3) = (Today’s R2 + Yesterday’s range)
• Resistance 2 (R2) = Today’s Pivot + (Yesterday’s range)
• Resistance 1 (R1) = 2 x Pivot – Low
• Pivot Point = (High + Close + Low)/3
• Support 1 (S1) = 2 x Pivot – High
• Support 2 (S2) = Today’s Pivot – (Yesterday’s range)
• Support 3 (S3) = Today’s S2 – (Yesterday’s range)
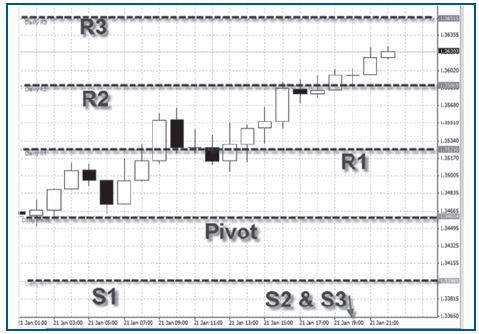
Yesterday’s range = the high minus the low. On a chart, the pivot lines will look like this:
Download a pivot point calculator for MetaTrader here
Find a useful pivot point calculator here
Here you’ll find a useful daily pivot point feature including live charts with pivot points automatically added and an indicator telling you where the price is in relation to the pivot points. Click on markets from the menu on the top, then ‘pivot points’.
How to use pivot points
Pivot points can be used in a number of ways with the most popular being to use them as price targets and identify likely support and resistance levels. In the example chart above, the pivot line formed a useful support line with the price bouncing off it in early trading. Then in the afternoon, the price struggled to break through the R2 for three bars before it finally managed to close above it.
Being aware of these lines can help you pinpoint price targets and stop losses.
Once these lines are broken however, they can be a useful momentum signal, i.e. it can take a lot of momentum to actually close above the R2 or below the S2, so once this happens it can be a sign of further movement to come in that direction. You can see in the chart above that the EUR/USD broke through the R2 and continued to move higher.
Daniel Fernandez has recently published a system that takes advantage of this idea in Currency Trader magazine and has kindly agreed to allow the system to be shared with our readers:
The Momentum Pivot System
The system has easy-to-spot entry criteria with profit levels and stop losses inputted to allow set-and-forget trading.
The system has been tested on the EUR/USD using hourly charts.
The entry logic is simple:
• Go long on an hourly open above the R2
• Go short on an hourly open below the S2.
Long exits:
• Stop loss: The R1 level
• Profit Target: Your entry point plus the difference in pips between Pivot and R3.
• Or if the trade has been open for 30 hours.
Short exits:
• Stop loss: The S1 level
• Profit Target: Your entry point minus the difference between Pivot and S3
• Or if the trade has been open for 30 hours. The time-based exit is very important because trades could otherwise go for days without hitting either the stop loss or the profit target. If this happens, the system is more likely to be loss making as it implies that the underlying momentum that got you into the trade has died down.
Money management (spread betting):
Step 1. How much of your account to risk.
The system risks approximately 1.5% of your account balance per trade. So if you had £1,000, your risk per trade would be £15 and if you had £5,000, your risk per trade would be £75.
Step 2. How much to place per point.
The stop loss is the R1 or S1, so you need to work out the distance in pips between this and your entry point.
If you enter long at 1.3586 your stop size is the difference between this and the R1 which might be 1.3525. This is a difference of 61 pips.
To work out how 61 pips will mean a maximum risk of £15, divide £15 by the pips stop loss. Fifteen divided by 61 gives you £0.25p per point (which may need to be rounded up or down).
Setting up your charts
First you need to have the pivot points on your chart. Use one of the resources mentioned at the beginning of this article.
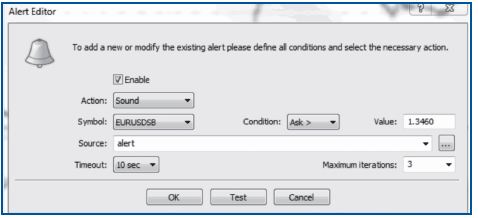
The next step is to set up an alert at the S2 and R2 level so you can go away and make other trades or get on with some work. The system won’t trigger every day and can go for well over a week without a trade, so you don’t want to be staring at your screen the whole time.
Below I’ve set up an alert for MetaTrader which will make a sound when R2 is hit. To set up alerts right click on the Alerts tab within the terminal menu. Click “view” if you cannot see this tab. I’ve recorded a video showing you how to do this which you can view here.
There is no rush to get your profit targets or stop losses working as the most common form of exit is for the trade to last 30 hours. Having the stop loss in place is the important thing though.
Example trade
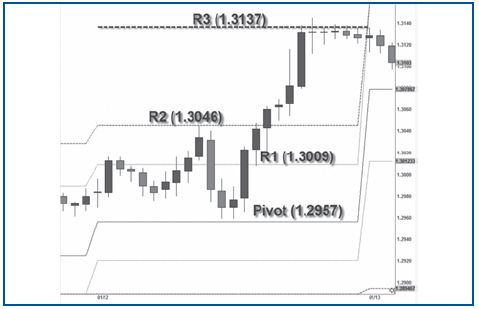
The chart below is of the EUR/USD on the 12th of January 2011. One bar is an hour’s action.
I’ve labeled the pivot and R1, R2 & R2 lines.
Entry: Entry was made at 4PM when the EUR/ USD opened above the R2 line, initiating a trade at 1.3062.
Stop Loss: The stop loss at the R1 line was 53 pips away with the profit target at 1.3137.
If you had a £1,000 account, a 1.5% risk would be £15.
The stop loss was 53 pips.
Therefore the amount risked per point when spread betting would have been £0.28p or rounded up to £0.30p.
Profit Target: The profit target size is the difference between the R3 and the Pivot. The R3 above is 1.3137 and the pivot was 1.2957. This gives a total of 180 pips. When we add this to our entry, our profit target becomes 1.3062 plus 180 pips = 1.3242.
Below is the same set-up from the 12th, this time with the trade points on it.
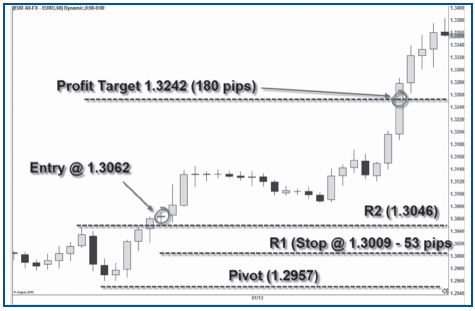
The EUR/USD continued to rally strongly but hit resistance (incidentally around the R3 line!). The trade then meandered overnight until the euro caught a fresh gust of wind on the 13th carrying it up to the profit target of 1.3242. The trade lasted nearly 24 hours.
At £0.30p per point, this would have meant a gain of 180 pips or £54 for a risk of £15, which is a very attractive risk to reward ratio.
Performance and Expectations
With many trades lasting the full 30 hours, this is not the sort of system for anyone needing high octane trades on the 1 minute charts. However, A) It is an incredibly low maintenance system with no further input required once a trade is set up and B), it is profitable, which is the ultimate point.
The risk/reward ratio is excellent with the average profit being 1 1⁄2 times the size of the average loss. The strike rate isn’t huge, but is certainly manageable at 44%.
The system triggers a trade roughly every three to four days on average, but they are rather like buses and you might find no trades for weeks followed by back- to-back trades. Using the suggested money management, the total return over 11 years is 122% with a maximum drawdown of 17.28%. Again, this represents some solid performance in terms of risk/reward. If taken as part of a portfolio of trading systems, this pivot point strategy could really add a string to your bow.