 I have discovered that by taking a 20 period average of the DVB indicator, you can create a very effective long term EUR/USD trend filter.
How to set up the EUR/USD trend filter for MetaTrader
Download the DVB indicator here.
NB: The DVB is also called the DV(2) bounded. It will be in your custom indicators folder.
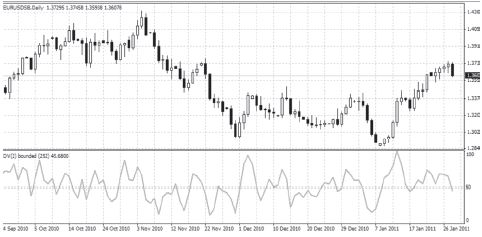
When the indicator is loading in your charts, it will look a little something like this:
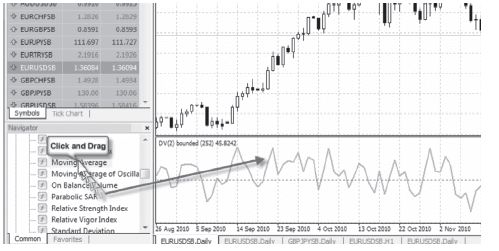
Next you need to make an average of the DVB. To do this, find the “Moving Average” in the Navigator panel. This will be in the indicators folder. Click and drag this into your chart.
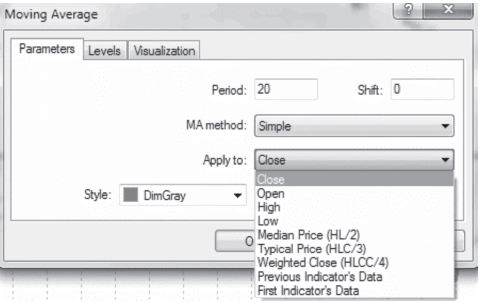
A dialogue box should popup as below. On the dropdown menu next to “Apply To”: select “Previous Indicator’s Data”.
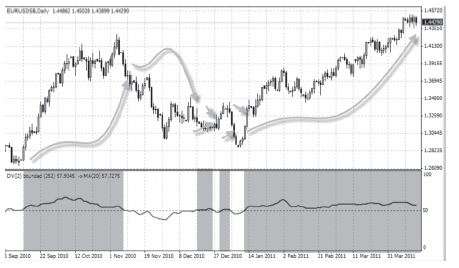
If you want to show the average DVB only, change the colour of the DVB to None. Right click on the chart then select the DVB.
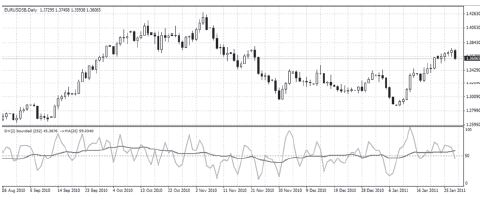
You can then go into your indicator settings and make the DV2 colourless so you just see the average. Above you can see an example chart with the slower moving DVB average moving between the DVB.
A fairly basic strategy for the indicator is to go long on a reading greater than 0.5 and short below a reading of 0.5.
This strategy has done an excellent job of capturing the main trends since the year 2000, producing a profit of over 12,000 pips.
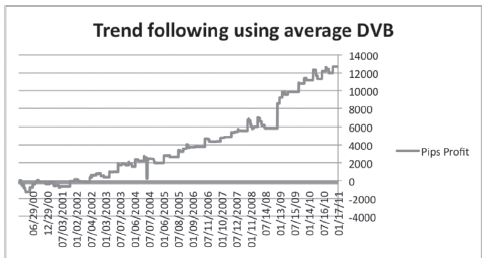
This excludes the current long signal initiated in January and is still live, which failing a huge move is likely to generate a good profit. The chart below shows the signals on the daily chart since 2010 with the long signals shaded in blue and the short signals shaded in white.
Like any trend filter, it gets knocked around in choppy markets, but when a trend kicks in, it does an excellent job of keeping you in it. The current long trade was initiated in early January and is up over 1,300 pips at present.
I have been using it to trade around the EUR/ USD during this time and found it be an incredibly useful way to fine-tune shorter-term trades, saving me a pretty penny by avoiding a number of shorts I would have taken.
To further demonstrate the effectiveness of this indicator, I wanted to show how it could be used to improve the profitability of an intraday breakout strategy. Logically, intraday breakouts are more likely to occur in the direction of the underlying trend so if you have a good way to assess this trend, you should be able to improve the performance of most intraday systems with the exception of short term scalping.
Momentum breakout strategy
There are three parts to the momentum breakout strategy:
Load up the 60-minute charts.
1) Entry & Exit levels.
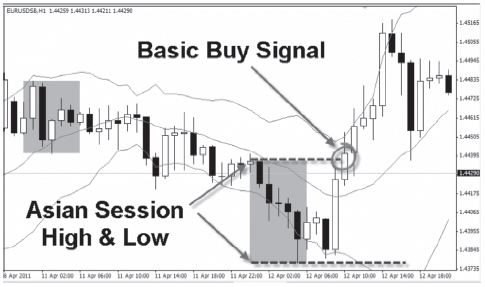
a. The basic long entry is the price closing above the highest level seen during the Asian session (i.e. the highest point between midnight and 06:00). The basic long stop loss is a close below the Asian session low.
b. The basic short entry is the price closing below the lowest level seen during the Asian session (the lowest point between midnight and 06:00). The basic short stop is a close above the Asian session high.
2) Momentum filter – Bollinger bands.
The first momentum filter is based on Bollinger bands set to 14 periods and two standard deviations. Do not go long if the price is already above the upper Bollinger band as this implies the price has got too far up too quickly. Do not go short if the price is already below the lower Bollinger band as this implies the price has moved too far down too quickly.
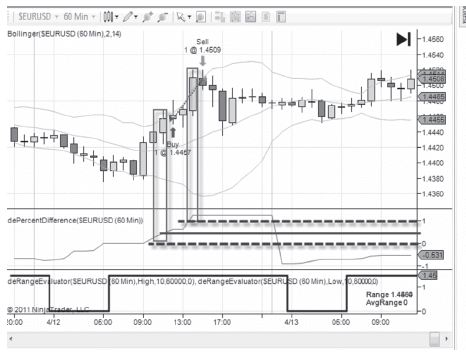
Before adding in the next steps of this strategy, let’s have a look at a basic trade set-up:
Here the EUR/USD closed above the Asian session high around 08.00 and at the time is still within the limits of the Bollinger band.
3) Volatility filter.
To really work, we need the day to have the potential to push higher. A breakout strategy is unlikely to succeed if the market is showing muted activity that day; any breakout attempt would be more likely to fail.
Just like Goldilocks, we want this volatility to be not too hot and not too cool.
The strategy uses a relatively simple measure of volatility based on the day’s trading range.
The range is the difference between today’s high and the low. A simple way to calculate this is to use the Average True Range indicator which comes as standard in any charting program and set it to 1 day’s range on the daily chart. This will then show you the day’s range which will increase as the activity levels throughout the day make either increasing higher highs, lower lows or both.
The rules
Today’s range at the point of entering the trade must be bigger than yesterday’s. This is important because it infers that there is enough trading enthusiasm out there to give our breakout trade the momentum it needs.
We also don’t want there to be too much activity as this might mean that the momentum is already spent by the time we enter the trade, so while we want today’s range to be greater than yesterday’s, we don’t want the range to be more than 50% bigger.
Finally, we also use the day’s range as an exit. We automatically exit the trade when today’s range is 100% bigger (twice the size) of yesterday’s. Most of the time this will be your profit target, but on certain days it could be your stop loss as well.
Summary
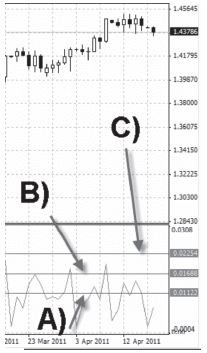
Note the size of yesterday’s range, e.g. 100 pips.
Note what level would be 50% bigger than this (150 pips).
Note what level would be 100% bigger than this (200 pips).
On your chart – in the area with the Average True Range indicator – mark up 100 pips, 150 pips and 200 pips. These are your volatility filters as well as potential entry and exit points.
For my testing I had a coder create an indicator, which displays today’s range as a % of yesterday’s, but you don’t necessarily need this; the 1-day average true range will do.
Let’s go back to that trade example from before to see if it would have been any different with the volatility filter.
You can see that the entry came a little later as we had to wait for the day’s range to climb above yesterday’s. The addition of the volatility filter does cut down your trades, but overall will leave in more of the profitable trades and cut out more of the losing trades.
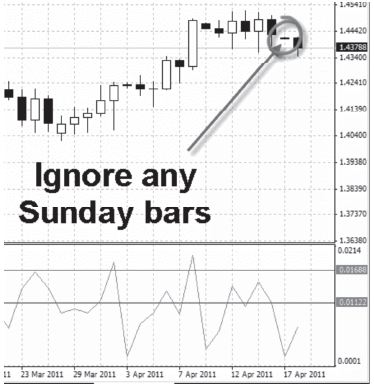
Note: if using MetaTrader, some brokers will count early Sunday trades as a “day”, which may lead to some confusion in trading range sizes. When making your comparisons, make sure you compare today’s range to Friday’s range, not the early Sunday range, which will often be negligible.
I’ve drawn the three relevant lines on the EUR/ USD daily chart below:
First, if your broker puts early Sunday trading as a separate day, ignore this.
Below I’ve drawn a line to show Monday’s range A), then B) the range size that would be 50% bigger than this, then finally C) to represent the level that would show the range being twice as big.
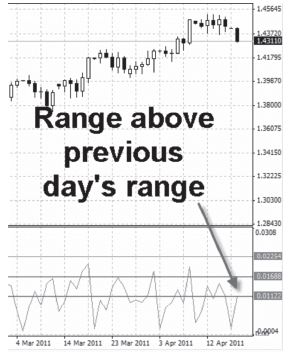
As the day progresses, we see the EUR/USD has dropped further with the range now rising above the bottom line. We would start to look for trades from this point.
Results
Let’s take a look at the returns on the system since 2005 using the rules we have included thus far:
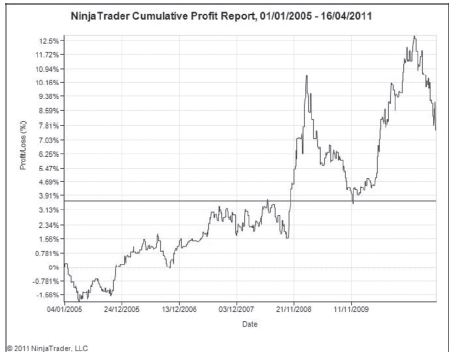
The system makes a profit but it’s not exactly a smooth ride. The main culprit in this is the performance of the short trades. Since 2005 the EUR/USD has mostly been on a rally so it’s little surprise to see that short trades have struggled over that period. By contrast, the long trades have been very profitable. The chart above shows both long and short trades.
The simple answer would be to say that the system goes long only, but this would not be sustainable and the decision has only been made with the considerable benefit of hindsight.
What we need is a filter, which will tell us the overall market trend and only take breakout trades in this direction. This would be applied going forward.
This is where the average DV indicator comes into its own.
Adding the trend filter
We only go long when the average DVB is above 55 (strong uptrend) and only go short when the average DVB is below 45. We base this on yesterday’s reading.
So, in the morning you will know well in advance whether to ignore short trades or long trades. Indeed, if the average DVB as of the close yesterday is between 55 and 45 then there are no trades to take at all today.
Once you apply this filter, results improve dramatically.
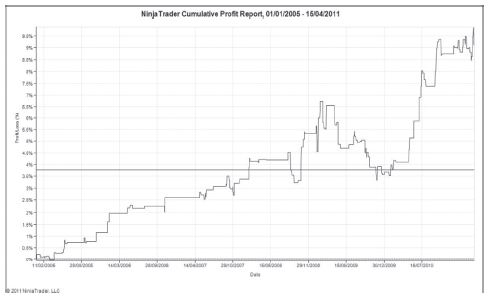
The average winner makes 39 pips, while the average loser is 31 pips. The system has a 55% strike rate which is impressive considering the average winner to loser size ratio. The maximum number of losing trades on the trot is 4.
Below you can see a typical successful trade set-up, from the same period as the example earlier. Yesterday’s average DVB (not shown) was above 55. The price rose above the Asian session high at a point where today’s range was above yesterday’s but not 50% bigger. The price continued to rise and the trades was closed when the day’s range became 100% bigger than yesterday’s. The trade produced a profit of 52 pips.
I had a coder create an indicator that automatically compares today’s range to yesterday’s. At present this is only available on the NinjaTrader platform, but I hope to have it coded ffor MetaTrader ASAP.
The line starts below 0 then increases throughout the day as the day’s range increases. When it reaches 0 it means the day’s range is the same as yesterday’s. A score of 1 means it is 100% bigger than yesterday’s.
One thing to be very much aware of is the low number of trades with the trend filter helping to cut down trade numbers considerably. The advantage of this is that it is easy for you to discount long or short trades early before the day gets going. Depending on volatility, there will be around three to four trades per month.
Chart set-up:
EUR/USD Daily chart:
• 20 period average of the DV2
• 1 period Average True Range.
EUR/USD 60 minute chart:
• Bollinger bands set to 14 & 2.
• Session Range Indicator to help you mark the highs and lows of the Asian session.
Long entry:
• Enter trade only between 06:00 and 19:00.
• Price must be above the Asian session high on a closing basis.
• Price must be below upper Bollinger line.
• Today’s range so far must be bigger than yesterday’s but not 50% bigger or greater.
• Yesterday’s average DV2 must be above 55.
Long exit:
• Exit the trade on a close below the Asian session low (stop loss).
• Exit the trade if today’s range climbs to become double yesterday’s.
• Exit at the close otherwise.
Short entry:
• Enter trade only between 06:00 and 19:00.
• Price must be below the Asian session low on a closing basis.
• Price must be above lower Bollinger line.
• Today’s range so far must be bigger than yesterday’s but not 50% bigger or greater.
• Yesterday’s average DV2 must be above 55.
Short exit:
• Exit the trade on a close above the Asian session high (stop loss).
• Exit the trade if today’s range climbs to become double yesterday’s.
• Exit at the close otherwise.
The bottom line
The breakout strategy described here could no doubt be improved by tweaking some of the variables, but it offers a fairly solid strategy as it is. My principal purpose with this article wasn’t to show you the breakout strategy per se, but to demonstrate how you can use a powerful trend filter like the average DV2 to improve on the performance of intraday systems like this.
You can find further video guides and the complete NinjaTrader strategy available via our resources page.