There’s a definite tendency among traders to chop and change between indicators: when one’s let us down, we just swing on to the next, desperately seeking perfection.
I generally advise against this – the problem usually lies with the application of an indicator, rather than the indicator itself.
But occasionally, it’s good to take a look on the shelf to see if there are any old indicators up there that have been gathering dust, just waiting for you to discover how well-suited they are for your trading style.
So, that’s what I’ve been doing – dusting off the tomes on technical analysis, and digging out some old favourites (and ones you’ve probably never heard of before).
First up is the Donchian channel, and its sister, the Aroon indicator
If you’ve read much about the Turtle Traders, then you’ll have already heard of Donchian channels. If not, they may be new to you.
Not all trading platforms have them as standard, but they’re not so unusual that you should be able to find them. I picked them up on my ETX free advanced charts very easily.
They look a bit like Bollinger bands, forming a channel around the major price action, but they’re actually a lot simpler than a Bollinger band – they just measure the highest high and the lowest low for the past 20 periods (you can adjust this to different numbers of periods, but 20 is the standard).
The middle line between them is an average of the two.
The Donchian strategy
The standard rule to apply with Donchian channels is to go long when the price crosses above the upper line; and to go short when it crosses below the lower line.
Because the edges of the channel are nothing more than recent highs or lows, this is just a breakout strategy – when we break a recent high, we go long; when we breach a recent low, we go short.
Donchian channels can also be used as a measure of volatility, a bit like Bollinger bands – when the channel is narrow, volatility is low; when it’s wide, volatility is high.
The Turtle Traders also used them to time exits.
So, if they entered a long trade when the price crossed above the 20-day Donchian channel, they’d exit the trade when it fell back below a 10-day Donchian channel.
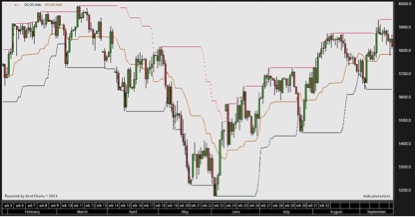
So now we need two sets of Donchian channels on our charts… It’s starting to look quite crowded…
Here, the 20 channel is marked by the pink and green lines; and the 10 channel by the red and blue lines. This example shows the strategy working brilliantly in a trending market, but then failing in a sideways market. Clearly we need something more here.
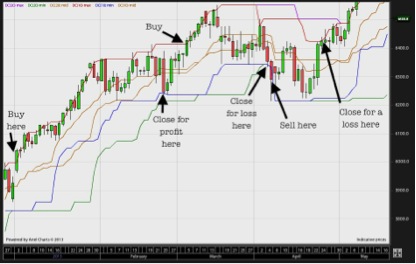
The Turtle Traders used trailing stops, which are a great friend of the trend-following trader, allowing us to take the most out of big market moves, but to get out quickly in sideways markets.
Plus, they added in the 25- and 350-period moving averages as a trend filter.
I mentioned the Aroon indicator at the beginning of this email…
The Aroon indicator uses a very similar calculation to the Donchian channel – i.e. the highest high or lowest low within a given period of time. It just looks different.
Here it is on a chart…
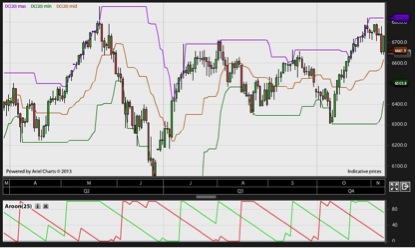
The word ‘Aroon’ is Sanskrit for ‘dawn’s early light’, which is its creator, Tushar Chande’s, very poetic way to describe a new high or low. In addition to the information in the Donchian channel, it also plots how long it’s been since that high was hit.
Via this, the Aroon indicator claims to give information about how strong a trend is – above 70 indicates a strong trend; below 50 indicates a weakening trend.
Worth keeping, or back on the shelf?
While I like the simplicity of these indicators, I find that I’m also slightly frustrated by them.
Personally, I’d rather look at my charts and choose my own recent high and recent low to work from. However, if you’re not confident with marking support and resistance levels – or if you want to automate signals on your trading platform – these can be really useful tools.
You can set up an automatic alert to tell you when the Donchian channel has been breached, or when the Aroon indicator reading hits a level – then you’ll know that it’s time to check your charts for a possible breakout trade.
If you’re successfully using either of these signals, I’d love to hear about it.
If there’s any indicator you’d like me to cover in future emails – please drop me a line.