 Okay, so you’ve got a signal to trade – great.
You might even know where you want to put your stop loss.
But how on earth do you gauge where to take profits? How far is the market going to move?
You don’t want to get out too soon, and miss out on a big move.
But you also don’t want to be greedy and fail to ever reach your profit target.
The tool I want to show you today, is a real favourite of many traders, and one of the trading techniques that I’m asked about most often.
I’m talking about Fibonacci levels.
There’s a degree of mysticism about Fibonacci trading. And the science behind it has a venerable history, going back to the thirteenth century. Fibonacci sequences appear all over the natural world … in the breeding habits of rabbits … in the arrangement of leaves on a stem … in the uncurling of a fern … and they’re even in the “unnatural” world, like in the way cities develop and grow – and, we’re told – in the way prices on the financial markets move.
Its proponents tend to fall into one of two camps:
- The first is those who believe there is an intrinsic truth in the power of the number 1.618. It’s hard to argue with a breeding rabbit or the shape of a cauliflower, but market prices? Really?
- And the second group are those who know that Fibonacci sequences are used by many, many traders, and have become a self-fulfilling signal on our charts.
The thing is, it doesn’t really matter why the market reacts at Fibonacci levels – just that it does. So, as traders, we need to have a plan of how we’re going to use this crucial information.
What are Fibonacci Levels
A Fibonacci sequence looks like this: 1, 1, 2, 3, 5, 8, 13, 21, 34, 55, 89 … etc.
Each number is the sum of the previous two numbers.
The magic number hidden in that sequence is called the “golden ratio” – 1.618 (or its inverse, 0.618). This is found by dividing one number by the next, and as you progress through the sequence, you move ever closer to this “magic number”.
Therefore, the key figures that the Fibonacci trader needs to know are:
61.8% (one number divided by the next number), 38.2% (divided by the number next but one) and 23.6% (divided by the number next but two away).
Fibonacci lines will generally also include the Gann level of 50%.
How to draw Fibonacci Levels
One of the reasons many traders don’t like Fibonacci levels is that they require some discretion in drawing them.
Not every trader will have their Fibonacci levels drawn in the same place on their charts, because these lines are dependent on where you judge your recent high and low to be.
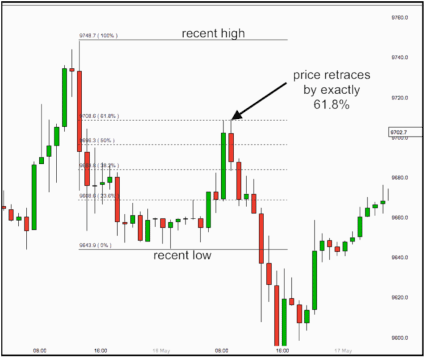
Once you’ve judge your recent high-low – one becomes your 0%, the other your 100% – and your all-important 23.6%, 38.2% and 61.8% will appear inbetween the two.
Here’s an example …

The recent swing high/low that you use for your Fibonacci levels has to be in line with the timeframe of your trading and the scale of the move you’re following.
Strictly speaking, a high is typically identified by a recent high, with two lower highs on the left and right of the high itself. And a low would be a recent low with at least two higher lows on either side.
However, charts are often simply not that tidy for us. And getting your recent high/low may take a little practice to get right.
So, the next question has to be …
How do we use these magic levels?
Fibonacci levels are a very valuable tool to tell us where the market is likely to move to, and where it is likely to get stuck. For this reason, they make great profit targets.
It is common practise to set profit targets very close to Fibonacci levels. And if you’re placing multiple profit targets, then you may want to take profits at your first Fibonacci line … and again at the next key level.
Remember, that Fibonacci levels are just like any other support and resistance level, which means that there is often some congestion around them, as they will be a hot-spot for buy and sell orders. So, don’t expect neat text-book bounces – real trading is usually a lot messier than that!
