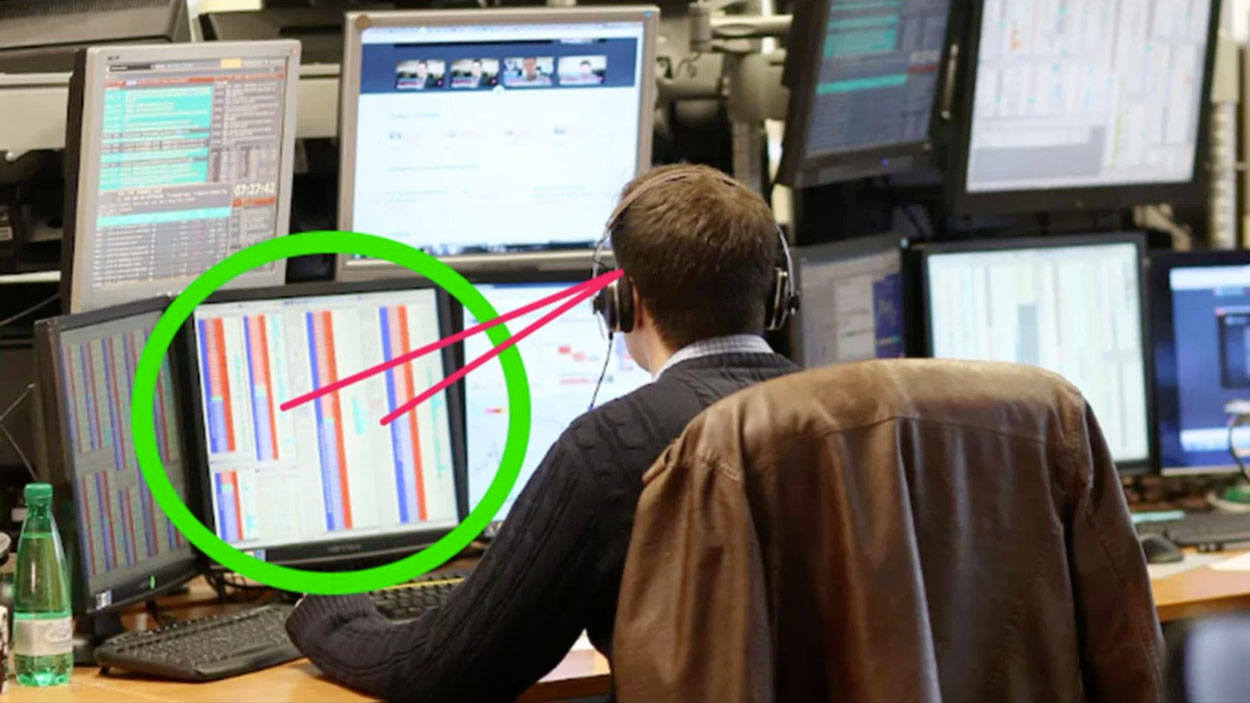
Take a look at the picture above.
There are no Bollinger Bands, MACDs, Moving Averages, RSIs or Stochastics…
None of the esoteric charting patterns beloved of technical analysts… Fibonacci retracements, double tops, heads and shoulders…
What you can see in the image above is a trader looking at what’s known as order flow.
Just the pure data of how much interest there is at any given price.
You see, all the pros really need to trade is the PRICE and VOLUME.
Back in the days of the pits, it was easy to see which prices had the most interest.
Many traders would use just this raw data to profit – the movement of the crowd and the rising volume of shouts – as a signal to where the action was.
All they had to do was literally follow the crowd and the noise.
Of course, once trading moved to the electronic terminals, these raw audio-visual cues disappeared.
And yet, if you know what to look for, it’s possible to track the same raw market forces… the professionals buying and selling…
What’s important is identifying which price levels are important to the market. In other words, the prices where the professionals are buying or selling in large numbers.
The truth is that one of the biggest causes of trading losses is due to our over-reliance on charts and indicators.
Unless you can dedicate a big chunk of your spare time to mastering technical analysis and all the charting tools, it’s like entering the boxing ring to fight Mike Tyson with both hands tied behind your back!
And yet we take it for granted that charts are an essential part of trading. We don’t want to look stupid or ill-informed, so we go along with the ‘received wisdom’ – even if deep down we feel there’s something not quite right…
But doesn’t it make more sense to base your trading decisions on what’s happening right now in the market rather than some complex combination of indicators or software…
I don’t know about you, but I’d rather use proven methods used by those legendary pit traders – whose fortunes and reputations were based on results – and not a chart or indicator in sight.
They traded REALITY – what was happening in the present moment.
No predictions or backtesting – just the hard data of what the professional money was doing at any given time.
Don’t get me wrong: I’m not saying charts don’t work.
They are great for when you need to identify longer-term trends. But their almost total dominance in the trading industry has stopped other equally legitimate (and profitable) approaches that are often better suited to non-professionals like us.
And now you have a chance to discover a genuine alternative to traditional charting approaches.
I’ve created a free step-by-step cheat sheet which show you exactly how Volume at Price or ‘VAP’ works.