
You know the first thing that gave me good, reliable trading results?
It was looking for a simple candlestick pattern: the bullish and bearish ‘engulfing’ pattern.
Of course, this only came along once I’d been through the mill a bit…
I’d fallen prey to trading various ‘magical’ combinations of moving averages, overbought signals on oscillating indicators and all that stuff.
I was well and truly searching for the Holy Grail of trading methods. You know – the magic system that NEVER loses.
And I was getting some pretty horrible results, it must be said!
So don’t worry if you’ve been there yourself – you might even be there at the moment. It seems to be a phase all traders go through as they learn their craft.
But if you are currently on your own quest to find the trading Grail, my advice is keep plugging away and get it out of your system as soon as possible.
Keep your risk to the bare minimum and let the market prove to you, as quickly as possible, what does and doesn’t work.
You can then focus your attention on understanding the inner workings of the market and get busy honing your ‘edge’.
Remember, you don’t have to be right on every trade.
You just need to make more money when you win than you give up when your trades make a loss.
THAT’S the magic formula!
So if you do need something to steer you away from a wild Grail-chase, I’ve got you covered…
First off, I thought I’d show you that simple engulfing pattern I learnt to look for. And while we’re at it, I’ll show you two more reliable candlestick patterns you can go to work on exploiting.
Now, I’m sure you’ve seen Candlestick charts before. They were originally developed and used in 18th Century Japan to track the price of rice contracts but they’ve become the chart of choice for many modern day Forex traders.
They really are very simple to understand and use. I’m going to cover three price patterns here but if you do need more information on the history of candlestick charting and a bit of insight into some more complex patterns, I’ll also show you the best book to refer to.
So here they are…
My top 3 Candlestick patterns to profit by
1. The Engulfing Pattern
A bullish engulfing candle is formed in a downtrend when a bullish candle (one that closes higher than it opened) ‘engulfs’ a smaller bearish candle that immediately precedes it.
And in just the same way, a bearish engulfing candle is formed in an uptrend when a bearish candle (one that closes lower than it opened) ‘engulfs’ a smaller bullish candle that came first.
There are also three things suggesting a higher probability of the engulfing pattern marking a key reversal point in the market:
a) The candle that does the engulfing has a very long, strong, real body and the candle being engulfed has a comparatively small real body. This marks a change in dominance between the buying and selling forces at work in the market.
b) The engulfing pattern is formed after a very fast move in the market. This can mark a reversal of directional bias as quick profits are taken and the initial impetus is absorbed and overwhelmed.
c) Heavy volume comes in on the engulfing candle. Easiest to see on stock or futures charts where accurate volume figures are displayed on the chart. This again marks a deeper interest in the immediate change of direction.
And here’s what an engulfing pattern looks like on the chart:
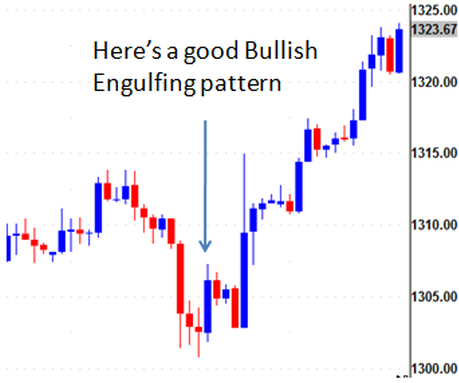
So we got this one on the hourly chart of Gold. You can see that downward move lasting eight hours beforehand. The move starts to fizzle out as we see those two candles with small bodies.
And then, BOOM! Buyers step in with intent.
The bullish engulfing candle was our cue to sit up and pay attention, and sure enough, the market rallies hard over the next 24 hours.
2. Doji
The doji marks a time period in which the opening price and the closing price are the same (or almost the same). It can be a reliable indicator of a forthcoming reversal, or at least a stall in the current trend. It illustrates a matching of buying and selling power in the market.
So if, for example, the market was previously heading in a strong uptrend, it can be significant to see sellers suddenly step in and equalise the buying strength. It makes sense to be on standby for a potential reversal now the bears have put in an appearance.
Two other factors can be taken into account to indicate a higher-probability doji signal…
a) You can build in the candles that follow as confirmation of the doji’s warning. You might let the doji put you on standby and actually enter your trade off the next bearish engulfing candle.
b) Pay particular attention when the doji appears in an otherwise doji-free market. If there are lots of dojis printing take less notice, it may be the market just churning its way through a choppy spell.
Here’s a bit of doji price-action on the chart:
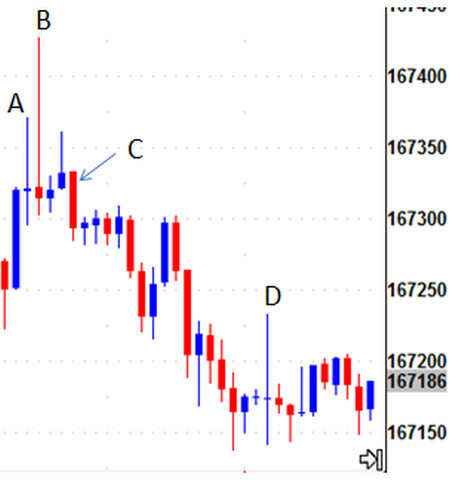
We’re on a 5 minute chart for this one…
A – We get a first warning of a forthcoming reversal/stall with that blue doji bar. Remember how the pattern shows a matching of buying and selling pressure?
B – The bulls have another run to the upside but the bears have put them back in their place by the time this candle comes to a close. Another (bearish) doji – you’d be sat to attention at this point.
C – A last feeble push upwards is overwhelmed as the bears wade in. The bearish engulfing candle could now be your signal to sell.
D – You can ride the wave down until a new doji grabs your attention. A bit of cage rattling from both sides, buyers and sellers are both trying to get a toe hold but this bar (D) closes at par. Nevertheless, this is your sign that the bear’s strength is exhausted, for the short term at least. It’s time to rake your chips off the table.
3. Tweezers
Tweezer tops occur when we get two (or more) bars with matching upper extremes. This can be matching ‘wick’ highs or matching real-body highs.
At the other end, tweezer bottoms are made by matching lower extremes – either the wick lows or the real-body lows.
And really, it’s just another way of illustrating the matching of market forces as the short-term trend starts to lose strength.
It’s nice to see the candles print prominently above/below the recent range of bars – hence the two-bar ‘tweezer’ image.
Let’s have a look at an example on the chart:
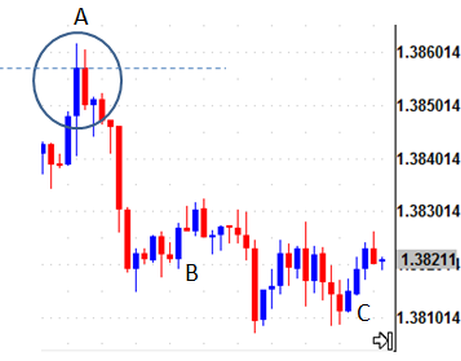
You can see the tweezers pattern circled.
A – We get matching highs on the real bodies, the candles stand prominent above the preceding price action, and the fact both candles have those little wicks suggesting a failed push to the upside adds to the bearish nature of this pattern.
B – If you got yourself into a short position following the tweezer, here’s your first warning of buyers coming in: bullish engulfing candle.
C – If you managed to hang on through B, the bulls come in again at C with another engulfing candle. The market has not really managed to extend the downward move suggesting bearish weakness. It’s time to take your profits!
So there are three simple reversal patterns for you. None of them use any complicated formulas or anything and they all have logical price action justifying their importance.
The key of course, is spotting the potential reversals in real-time! But, you know, that’s where I think time is well invested.
Rather than trying to come up with a new invincible ‘Holy Grail’ combination of lagging indicators, could you spend some time calibrating your eye to these opportunities instead?
Especially since they’re happening right under our noses, every single day.
And if you wanted to delve deeper into candlestick pattern analysis, here’s that book I mentioned:
The Candlestick Course (Steve Nison)
Be Prepared: Market Moving Data Coming This Week (London Time)
Wednesday 23rd November
08:30 EUR German Manufacturing PMI
13:30 USD Core Durable Goods
15:00 USD New Home Sales
15:30 USD Crude Oil Inventories
19:00 USD FOMC Meeting Minutes
Thursday 24th November
All day US Thanksgiving day
07:00 EUR German GDP
09:00 EUR German IFO Business Climate
Friday 25th November
09:30 GBP Gross Domestic Product
Monday 28th November
– no big reports
Tuesday 29th November
13:30 USD Gross Domestic Product
15:00 USD CB Consumer Confidence
Watch out for lower liquidity in the markets towards the end of the week as the US takes a break for Thanksgiving on Thursday (and then hits the shopping carts on Black Friday!).
Trade safely and I’ll catch up with you again next week.