 PLUS: How to Profit from Head and Shoulder Chart Patterns
 PLUS: How to Profit from Head and Shoulder Chart Patterns
In a glass case, in a museum, in Manchester – there’s an Egyptian statue that’s started spinning around on its own.
Have you seen the video of it?
It’s been doing this since February apparently. This small statue has sat quietly on site for 80 years and just suddenly sprang into action. It turns on its base in a perfectly circular arc.
Sounds too incredible, doesn’t it?
I only read about it in a magazine last week and didn’t need any further encouragement… this was something I had to go and see for myself.
So on Saturday, while Alice took the boys to their swimming lesson, Evie (my youngest) and I went to check it out.
It’s caused a bit of a sensation at the museum so they’ve got a curator permanently stood by the display. I had a chat with the lady there on Saturday.She said there were two main theories from within the museum faculty…
The spiritual theory is that the revolving is caused by the soul of the original owner – from 1800 B.C. – coming back to live inside the statue. It’s serving as a back-up vessel because the mummified body has been disturbed.
And the scientific explanation – offered by Professor Brian Cox – is that the statue spins because of some strange friction caused by vibrations between the glass shelf and the material the statue is made from.
The curator told me it only seems to move in the daytime, so it could be something to do with the museum visitors themselves. Perhaps their footsteps vibrate it slightly, or maybe – she said with a gleam in her eye…
“It’s feeding on the energy of people walking past”.
Whooah, spooky stuff!
So what do you think – return of the Pharaoh or just a wobbly shelf?
Personally, I like to think I’m open-minded. I just find it so difficult to believe we already know all the laws of nature.
And I’ve certainly seen some strange things in the markets. My mentors also used to warn me about powerful forces at work – I always thought they meant the traders of Goldman Sachs though!
If you’re of a curious mind and interested in unorthodox market analysis techniques, there’s no shortage of stuff to investigate. I’ve seen traders using sacred geometry, astrological predictions even the moon’s cycles to make trading decisions…
The one I’ll tell you about today though, does have some strong credibility…
Cold, hard cash – to the tune of a Billion dollars – backs this one up
So, I’m sure you probably know who George Soros is. “The man who broke the Bank of England” is one of the best-known and most successful investors in the world.
His most famous trade was when he bet against the British Pound in 1992. He calculated the Bank of England wouldn’t support the Pound to enter the European Exchange Rate Mechanism and he was right…
It made him $1 Billion richer OVERNIGHT!
But what might surprise you is that he didn’t have a complicated mathematical model of analysis. His trades have an almost mystical element to them instead.
He lets his body feelings – his intuition – tell him when it’s time to trade.
Here’s a quote from his son Robert, from the biography of Soros The Life and Times of a Messianic Billionaire:
“My father will sit down and give you theories to explain why he does this or that. But I remember seeing it as a kid and thinking… at least half of this is bulls**t.
I mean, you know the reason he changes his position on the market or whatever is because his back starts killing him. It has nothing to do with reason.
He literally goes into a spasm, and it’s his early warning sign.”
And as you read more about Soros, the same pattern occurs again and again. He uses his backache as a kind of on-board biological trading signal. Isn’t that intriguing?
But where do his trading-feelings come from – his subconscious mind, universal intelligence, the fourth dimension?
I’ll bet he couldn’t tell you, but I certainly wouldn’t mind a piece of the same action!
For me, I think it’s down to his subconscious mind noticing patterns in market data he’s not even conscious of.
The backache is his brain’s way of ringing the doorbell…
…making him sit-up and see what he hasn’t noticed yet.
Maybe it sounds a bit “out-there” but give this some consideration…
Your brain is the most complex object in the known universe. Current digital technology can’t get anywhere near matching what our brains do every second of every day.
Is it really so fantastic that Soros – totally immersed in his work – should receive results of calculations regarding his current trading considerations? Calculations his brain has run in the background without him really being aware.
And the most exciting thing of all is this: Somewhere out there is a trader with a more highly tuned intuition for trading than Soros himself – they probably just don’t know it yet.
Next time you get a twinge in the lower back, or a tightening of the stomach, scratch it down in your trading journal – see what market event your internal trading computer might have just foreseen.
Don’t go scrapping your trading system, but seriously… keep notes of your body feelings and go back and read through them.
See if there’s a common theme.
Do you get headaches on a regular basis just before your system gets you out of trades too early? Might be your brain’s way of telling you it’s noticed conditions are ripe to let your trades run.
And who knows… that ‘new Soros’ could be you!
N.B. If you’re interested – you can watch a time-lapse video of that moving Egyptian Statue on YouTube here.
Quick Charting Trick: How To Trade Head and Shoulders
Here’s a classic chart pattern. The Head & Shoulders set-up marks a short term-reversal in the market.
The pattern can be traded as a head and shoulders top (for a short entry) or viewed upside-down as a head and shoulders bottom (for a long entry). The beauty of this set-up is it gives a very reliable technical profit target as a built in feature.
For a head and shoulders pattern (in this case a H&S top) to be a trade-able event, we need to see a leg-up, a pause or pullback, a push higher which is repelled and a further pause or pullback around the same level as the first.
We’re then on standby to enter our short-trade on a break of the ‘neckline’ created by the lows of the two pause-areas.
Let’s see how to trade it:
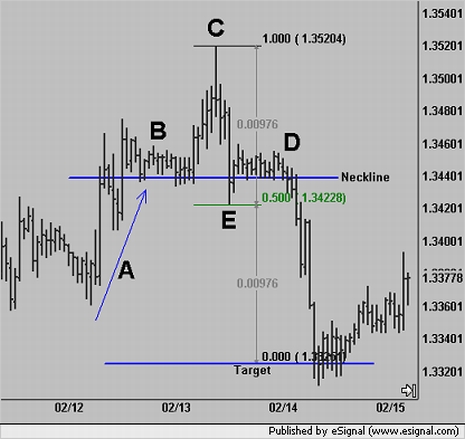
EURUSD 60-Minute Chart
A – There’s the leg-up followed by…
B – The pause or pullback that creates the left ‘shoulder’
C – Here’s the break to the upside that is quickly repelled. It’s only at this stage where the possibility of a trade-able head and shoulders becomes apparent. We’re now keeping an eye out for a second pause or pullback.
D – Here it is. The right ‘shoulder’. The two pause areas (B & D) correspond very nicely in this example. We’re now alert to the possibility of entering a short trade on a close below the neckline.
We enter a short trade on the close of the first 60-minute bar below the neckline. Initial stop-loss goes above the highs at D. We calculate the target using the lows at E…
E – We take the height of the ’head’ at its maximum (from C to E) and project the same value downward taking E as the starting point. This gives us a very reliable downside technical target. In this case it gave us a 4:1 reward to risk trade. Very nice!
Be Prepared: Market moving data coming this week:(London Time – BST)
Well, let’s see how much influence those comments from the new governor of the Bank of England – Mark Carney – continue to have this week.
Also, can the US Dollar maintain Friday’s momentum after better than expected Non Farms Payroll?
Wednesday 10th July:
19:00 US FOMC Meeting Minutes (USD)
19:10 US Bernanke Speaks! (USD)
Thursday 11th July:
13:30 US Initial Jobless Claims (USD)
I hope you enjoyed this week’s issue. Let me know if you catch any good gap trades on Sunday and until next time…
Happy trading!
The famous surrealist artist Salvador Dali would sit in a chair, relax and go into the meditative state of theta where he saw the surreal images he painted. Dali would hold some object in his hand so when he reached this inspirational state, his grip would relax and the object would drop. The noise would bring him to a state where he could remember the images he visualised in the theta state. The Genie Within , Harry W Carpenter.
As for that Egyptian artefact it looks a bit rude to me. You sure its not got a battery inside it?