 I love that my job allows me to work from home.
I love to hear the comings and goings of family life from the other side of the office door.
However, come the school holidays, the joys of family life are get louder and louder … and frequently burst right through my office door.
What I’ve noticed, from the relative sanctuary of my office, is that the energy levels of my children have an obvious ebb and flow. One minute there’s a frantic water fight going on outside the window… and 30 minutes later, everyone is vegged out quietly in front of the tv… and 30 minutes after that, enthusiastic pizza chefs are violently slinging dough around the kitchen…
The trick, Mrs Maven informs me, is to use the lulls to prepare yourself for the next burst of energy.
It’s what we do in most areas of life … when we take a holiday … when we have a quiet spell at work … and, of course, when we’re looking at the markets.
What to do when the market is taking a breath
When markets are trending, they are making new highs or new lows. This is when traders find it easiest to pick up profits. It’s a bit like buying during a property boom – put your money in, put your feet up, and you’re bound to cash in.
However, markets only trend for a small percentage of the time. The rest of the time, they are consolidating. And it’s during these breathers that traders should be prepared to catch the next big move.
And the trick comes with spotting consolidation patterns, judging the breakout of that pattern – and maximizing your profits from that breakout.
And top of my list of consolidation patterns has to be a triangle. When I see one of these, I’ll be watching for a breakout (not necessarily in the direction of the prevailing trend) and an obvious level to aim for with my profit target.
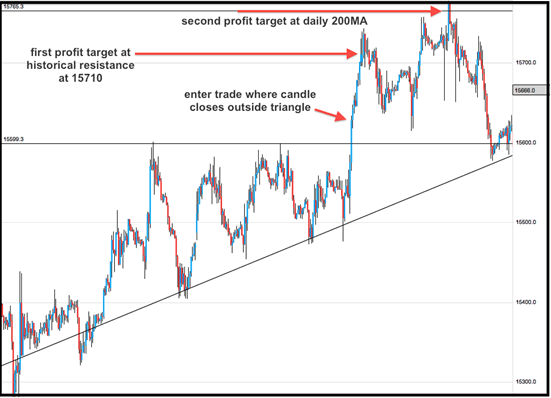
Here’s a couple of examples that have set up on GBPUSD over the last couple of months …
GBPUSD hourly chart in June: The best breakouts come hand in hand with lots of momentum – which we can see here in the long blue candles, which quickly power through to the first profit target.
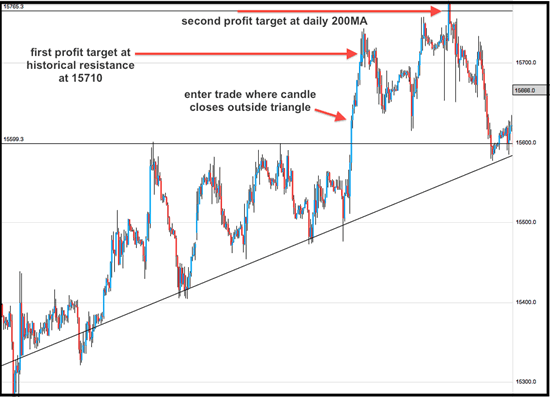
This breakout (below) on the same chart last month was less forceful, with a pullback to the rising trend line (as long as our stop is carefully placed below the trend line, this shouldn’t have taken us out). Pullbacks like this are very common, so we should be prepared for them on breakout trades.
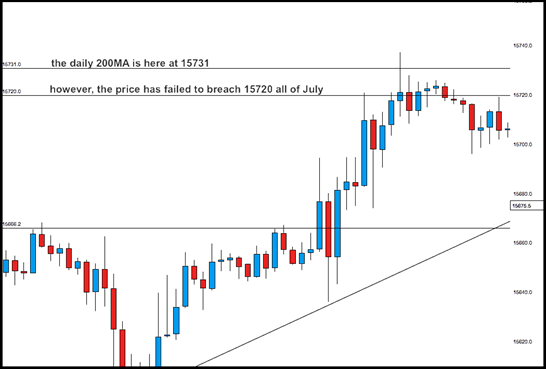
This time, I’d seen that the price had bounced back from 15720 a couple of times already that month, so set my first profit target here, and second one at 15731, on the level of the daily 200 moving average.
What you need to know about triangles
- Types of triangle:
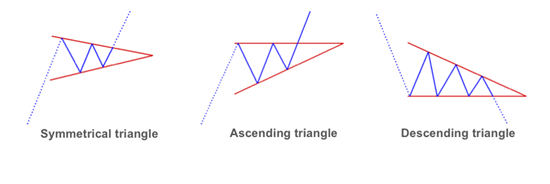
In a symmetrical triangle, the upper and lower trendlines converge at roughly the same angle.
In an ascending triangle, the upper trend line is horizontal, while the lower trendline is risking to higher lows.
And in a descending triangle, the lower trendline is horizontal, while the upper trendline is descending to lower highs.
- Breakout direction:
Strictly speaking, if you’ve a consolidation pattern, you’ll expect the price to breakout in the direction of the overarching trend. However, there are many, many factors that will affect which direction a breakout occurs in, and
with the fluidity of the markets at present, my feeling is that a breakout is a breakout. And if it’s got some momentum behind it, I’m not going to argue with the market that it’s going in the wrong direction!
The shape of our triangle holds some clues:
An ascending triangle suggests that there is a level of resistance at a certain price point, where sellers are coming into the market, but that buyers are continuing to purchase at higher and higher levels after each downswing. This is bullish behaviour.
A descending triangle shows the opposite behaviour, and has a bearish bias, as sellers come into the market sooner and sooner after each upswing.
- False breakout alert:
False signals are all part of the process of trading, and we have to judge how much trade confirmation we’re prepared to wait for. The standard would be to expect a candlestick to close outside the triangle. But the real danger area comes when a triangle is almost fully formed, like this …
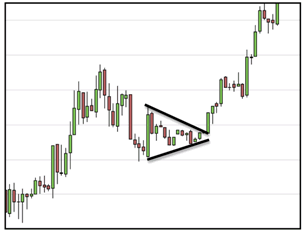
As we get close the apex of the triangle, the range of movement for the price gets very tight, and we’re much more likely to see false signals. Any breakout here should require extra trade confirmation to be sure that the market really has decided a direction.
- Setting a target:
The conventional wisdom for breakout moves from a triangle is to go for a profit equal to the distance from the highest peak to the lowest trough of the triangle pattern.
However, as you’ll have seen in the examples above, I’ve first looked for alternative targets based on levels of support/resistance that are already apparent in my chart.
