 As 2010 draws to a close, all eyes are looking for the “next big story” for the coming year.
And you’re unlikely hear market analysts making predications for 2011 without the mention of “commodities”.
Commodities are pretty much any primary product that can have a value applied to it: oil, gas, gold, silver, copper, wheat, soybeans, orange juice, and even pork bellies.
And these are the things that developing countries will be demanding as they grow. And, amid the doom and gloom of Eurozone crises and sluggish growth in developed countries, it’s easy to forget that elsewhere economies are booming.
In a quote from the FT this week: “The mistake is to read the market from London or New York, where there is a temptation to assume that the weakness of the local economies is the global reality. The reality however is that growth in China, India, Brazil or the Middle East is very strong.”
While we’re grumbling in the Western media that Chinese growth is slowing down, the reality is that global economic growth is set to reach 4.8% this year – well above the 3.3% average of the last three decades.
And what does this mean?
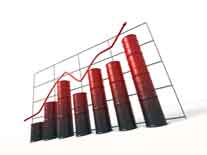
Demand for commodities – and more specifically, demand for oil.
From boom to bust and back again: the demand for oil
Let’s have a little look at historical oil prices:
After the oil bubble burst in the latter half of 2008, the price has been slowly climbing. And, since the summer, has been trading a fairly tight range between $80 and $90 a barrel.
That is until this week, when the price broke $90.
Despite the poor non-farm payroll figures last Friday, it seems that growth in developing countries and the prospect of a cold winter in Europe (don’t we know it!) were enough to give the price the push it needed to break the $90 barrier.
Immediately, the bulls pricked up their ears and began predicting $100/barrel in 2011.
Buyer beware
Of course, when everyone’s telling us we should buy something – it’s exactly the time that we should be taking a step back and wondering what the other side of the argument could be.
Let’s take another look at that chart with some Bollinger bands added:
If you’re not familiar with Bollinger bands – they are two bands that you can apply to a chart based on a 20-day simple moving average. The 20-day SMA would run through the centre of your chart, with the upper and lower Bollinger bands at a standard deviation away from it. In short – it creates a “channel” that you can expect the price to move within. If the price hits the top band, you can expect it to bounce back down; if the price hits the lower band, you can expect it to bounce back up.
In the oil chart, we can see that Bollinger bands have been providing clear support and resistance levels in recent months, and looking at this chart, we’d fully expect to see the price bounce downwards in the short term from the $90 level.
Of course, support and resistance levels can be broken, so we should be looking at how this price behaves, and whether it can break through the upper Bollinger band.
The price of commodities
Energy analyst, Charles Maxwell, speaking on Bloomberg this week said that although he was bullish on oil, he expected to see $100/barrel in the next 3-4 years, rather than in the next 3-4 months.
Certainly, looking at the chart above, it would look like we’re due for a correction. It’s worth remembering that the price of oil, and the economic growth that’s causing it to rise, are tightly intertwined – if the oil price goes up too sharply, the growth will be hampered.
And the price of money
The oil price reflects a broader trend across commodities, with copper, gold and silver all at long-term highs.
In 2008 and 2009, investors put money into commodities – these physical goods seemed safer than the paper money that central banks were rapidly running off their printing presses.
Now, however, the price of the dollar is rising alongside commodities. Rising commodity prices have complex economic implications. If they rise too fast, they’ll hamper the economic growth that’s leading us out of the worst global financial situation since the Great Depression. Already developing countries are being squeezed by inflation – and we’re not immune to it here in the UK, with inflation still above 3%.
So, as commodities get more expensive, we can expect to see the price of money rise too.
In the next seven days
On the subject of inflationary pressures – we’ve CPI figures out on Tuesday, expected to show UK inflation at around 3.2% – the same as last month, and well above the Bank of England target.
Surprisingly, US figures out on Wednesday for core inflation (excluding food and energy) are expected to be just 0.6%. Leading investor, Jim Rogers, however attacked these figures this week, saying “US government’s inflation data is a sham.”
He told a Reuters Summit, “Everybody in this room knows prices are going up for everything.”
Elsewhere, we have the ZEW economic survey and the industrial production figures for the Eurozone out on Tuesday.