 In today’s article, regular contributor Daniel Fernandez of recommended auto trading website http://asirikuy.com exclusively shares his new trading indicator, the Absolute Power Indicator. Over to Daniel…
The Absolute Power Indicator
Indicators are wonderful tools to guide us in our interpretation of market data. Although they do not provide any information which isn’t already present on the screen they do show us certain aspects of market behaviour which might not be easily interpreted by gazing at the charts.
Without a doubt one of the most important things we try to find out when looking at charts is whether we are within a strong trend or whether price is “leaning” towards any particular direction. In today’s article we will be exploring a new momentum indicator I’ve created – The Absolute Power Indicator – which is a more complex elaboration of the Elder Ray Index concept.
The Elder Ray Index, developed by trading legend Dr Alexander Elder, is a combination of three indicators (bull power, bear power and a simple moving average) which attempt to show us the direction the market is attempting to “pull” at.
The bear and bull power indicators simply show us the distance between the low or high of a candle and a moving average of a given period. The further a day’s low is from the moving average, the lower the reading will be for the bear power. The further the day’s high is from the moving average, the higher the bull reading will be.
The chart below shows a moving average with the bear power and the bull power at the bottom of the chart. You can see the bear power drops considerably as the price drops far below the moving average.
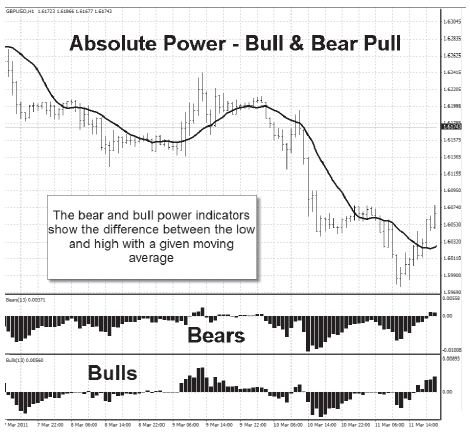
By contrast, in the middle of the chart, the price spikes above the moving average pushing the bull power higher (bottom pane) while the bear power only rises slightly. The high of the day rises significantly from the moving average, while the low does not.
The indicators show us how price is “pulling away” from a moving average (bear power below 0 means the bears are pulling while bull power above 0 means the bulls are pulling), allowing us to see momentum developments.
Although the concept is very interesting – allowing for the creation of many breakout and mean reversion type strategies, it lacks any in-depth information about how the current bear or bull “pull” fits in the context of previous bull or bear pulls. The Elder Ray Index gives you a score for today only and doesn’t take into account how today’s score compares to yesterday’s or the levels seen over the last week.
The idea with the Absolute Power Indicator is to use the Elder Ray Index indicators to create a more comprehensive picture of what the market is attempting to do.
If you consider a candle’s “pull” against a moving average as a favouring of price movements in that direction then evaluating the number of “pulls” over a certain number of periods would give us an idea about trend strength.
Strong trends are in effect the result of the price moving against an average over a certain number of periods. Looking at “trends” from this perspective allows us to see clearly when trending movements are starting to “wither” since the “pulling force” of bears and bulls starts to equalize.
The Absolute Power Indicator is composed of three different lines which are calculated as follows:
Absolute bear power = 50 period bear pull count *100/ 50 Absolute bull power = 50 period bear pull count *100/ 50
Absolute power = Bull pull count – Bear pull count|*100/ 50
The default levels use a 30 period moving average for the bear and bull power levels and a look back period of 50 for the absolute power counts, but this is customizable.
The good news is that you don’t need to know these calculations as I have created an Absolute Power indicator that can be used in MetaTrader.
This can be downloaded here:
http://davesbrain.blogs.com/files/absolute_power.ex4
Absolute Power
Below you can see a chart with the Absolute Power line indicating a buy. The solid line is the Absolute Power line, the dotted line the Absolute bull power and the staggered line the Absolute bear power.

As you can see, the lines are normalized to 100 meaning that they will always vary between values of 0 and 100. The Absolute bear and bull power indicators will show us the amount of “pulls” bears or bulls have won over the past X periods while the Absolute Power Indicator will tell us the absolute value of the difference between both.
How to use the Absolute Power line
Whenever the Absolute bear or bull power reaches 100 it means that all “pulls” during the past X periods have been due to bears or bulls while the Absolute power line helps us see the “struggle” between bears and bulls.
Whenever the line reaches 0 we are within a ranging period – bear and bull pulls have been equal during the past X periods – while a value of 100 means we are in a strong trend.
So the Absolute bull and bear lines tell us the direction, while the Absolute power line tells us the strength.
The usage of this indicator can be varied according to what you’re trying to capture. For example, whenever the Absolute Power line reaches 100 and the bear or bull Absolute Power lines reach this same value it becomes evident that a strong trend has developed towards the down or up sides respectively and therefore this could be interpreted as the right time to enter positions in either direction (to follow a strong trend). You can then leave a trend whenever the value of the Absolute Power index drops below 100 as this shows that “the other side” is gaining momentum.
Below you can see an example of how the Absolute Power Indicator can be used to spot weakness. The dashed lined is the bear Absolute power with the solid line being the Absolute Power. Both hit 100 as the price dropped, indicating a strong down trend. When the Absolute Power dropped below 100, it hinted that the power of the bear trend was diminishing, giving you a nice exit signal.
The Absolute Power Indicator is very useful because it provides an easy interpretation of how bear and bull forces have been behaving within the past X periods, allowing us to see how each side is “tackling the other” as trends, ranging periods and retracements develop. The indicators show loss of momentum shifts to ranging periods and trend starts and continuations in very clear ways, which makes market interpretation and trade entry/exit easier.
Another way to use the indicator is to help you avoid periods of trading indecision. Below you can see the bear and bull power lines crossing each other, a sign of uncertainty and perhaps a time to step away from the market with the price going sideways following it.
The bottom line
The indicator has been primarily designed for the higher time frames (daily and hourly), but it could still have use in the much shorter time frames.
Of course it is very important to remember here that indicators are not crystal balls. The Absolute Power Indicator is showing you an interpretation of what has already happened and therefore it is up to you to make use of this interpretation to draw valuable forecasts. Remember that whenever you’re designing a trading system using a given entry logic, adequate edge ratio analysis over the long term becomes necessary to see if your entry actually holds a tradable edge. Since the Absolute Power Indicator gives clear values for bear/bull “pulls” and their difference it also becomes a valuable tool for the development of mechanical trading strategies, an area I am currently exploring.
Below you can see an equity chart of a simple system on the 4 hour USD/ CHF which has similar rules to the ideas mentioned in this article, i.e. something along the lines of going long when the bull power and Absolute Power are at 100 and going short when the bear power and Absolute Power are at 100. Going flat at all other times. These aren’t the specific rules that created the system below but are not far off.
Daniel Fernandez
Downloading the indicator:
The indicator is available for MetaTrader and can be downloaded here: http://davesbrain.blogs.com/files/absolute_power.ex4 and a guide to downloading and installing the indicator can be found here: http://tinyurl.com/62DK2NA