 A common trading adage is to “follow the smart money” and generally do the opposite of what the dumb money is doing. This sounds great in theory but how do you identify just what the smart/ dumb money is up to?
There are various ways of doing this depending on the market you are trading, but for decades a highly popular method is to study the latest Commitments Of Traders (COT).
The Commitments of Traders Report – what is it and why should you use it?
The Commitments of Traders report released each week breaks down the current trading positions of futures traders across various markets, with traders split into three broad categories:
1) Commercial Traders (Smart money): These guys are primarily big industrial firms such as Coca-cola or BP which might take futures positions on currencies in order to hedge their overseas earnings. As these transactions are often hedges, you’ll see the commercial traders often buying in the opposite direction to the one you would expect. For example, they might continue to buy euros during a downtrend.
2) Non-Commercial Traders (Dumb money): Non-commercial traders are made up of money managers, some hedge funds and general large speculators.
3) Small/ Non-Reportable Traders (Dumbest money): Small traders and those who do not fit into either of the categories above.
I’ve labeled the categories as dumb or smart money, but this is an oversimplification. Quite often the dumb money is very right and sensibly offloads a position, during a downtrend for example. Where things get interesting and where COT data is of most use is at extreme points such as when there is extreme dumb money interest at multi week highs.
You can download the data each week from the CTFC website but you don’t actually need to do this as there are many free locations where you can look up live COT charts such as http://www.timingcharts.com
However, recently I have been using a tool from http://www.cot4metatrader.com which makes things even easier as it allows you to view the latest COT charts directly in MetaTrader.
Trading COT reports
Before I explain a little more about the tool, let’s first examine what a COT chart looks like. Below you can find a weekly chart of the AUD/ USD with two COT categories below it. As COT is only updated once per week, it makes the chart a little more interesting if focusing on the weekly charts only, but the daily charts can still be useful for reference.
I’ve labeled the commercial traders as the black line and small traders as the grey line (the dumb money). You will usually see three lines on a COT chart, but I’ve omitted the non-commercial traders here to keep the chart clean.
The chart shows the COT index which bounds actual net positions between 0 and 100. If you wanted to view the net positions, the chart would look roughly the same but there would be slightly more extreme points registered.
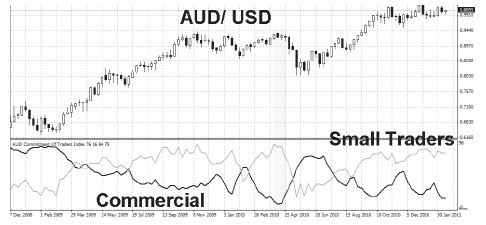
You can see the two types of traders tend to mirror each other. It also shows why it’s useful to look at the different categories relative to each other, not just each in isolation. From Feb 2009 there is a steady build-up in interest from small traders and for the most part they got this right as the AUD/ USD continued to rise. However, in March 2010, the smart money and the dumb money diverged significantly. Small traders registered their highest interest while the smart money was registering a low interest – an extreme inflection point.
Pretty soon the AUD/ USD sold off for three to four weeks until the interest levels had swapped. It’s interesting to note how at the time of taking the screenshot, the small traders were hot on the AUD/ USD while the commercial interest was at its lowest level for some time. These levels continued to diverge into March giving a decent heads up for the rapid sell-off in the AUD/ USD following the Japanese earthquake.
COT4MetaTrader
There are some free COT indicators for MetaTrader available on the Internet, but they can be a little complex as COT data has to be downloaded externally outside of your broker.
The best solution I have found is not free, but on the other hand is certainly not expensive and does all the complicated work for you.
The indicator package is downloaded from the COT4MetaTrader website and is downloaded and installed just like any regular MetaTrader indicator. The difference is that the indicators require an up-to-date COT datafile, which is where the subscription to COT4MetaTrader comes in.
Once per week, the latest COT data is emailed out as a single file and this is saved in a particular folder within MetaTrader. The data is forex specific and only available on major dollar pairs as this is what the futures data focuses on.
The available data includes:
• EUR/ USD
• GBP/ USD
• USD/ JPY
• USD/ CHF
The indicator can be a little memory intensive so it’s best not to apply it to too many charts at the same time. It does work as intended though and I’ve experienced no problems so far.
Using the COT indicator
The first thing to stress about any COT method is that it is certainly not a magic bullet and of very little use for intraday trading unless you are looking at the bigger time frames for an idea of stronger winds that might be blowing your way. If you’re a 10-pip scalper the COT will be of no use whatsoever though.
For longer-term trades lasting weeks/ days or even months, the COT indicator can be a leading indicator with the smart money leading the way before price action follows, but in general COT data is best used in conjunction with your technical or fundamental trading ideas. In this way COT could be a good final confirming filter for a buy signal or alternatively, you may wish to start with COT then look for confirming action in technical analysis.
In general the non-commercial and small non-reportable traders move very closely together so you’re best off putting one or the other on the chart against the commercial traders to keep things nice and clean.
Rarely will markets react straight away to COT index imbalances, the response at extreme levels can be delayed by a few weeks. Some traders prefer to look at the net positions, while I prefer to keep it simple with the index so that levels are bounded between 0 and 100.
I personally use COT as a lead indicator at extreme levels and as a confirming indicator at other times.
A good example of this is in the chart of the EUR/ USD below:

NC = Non-commercial (dumb money)
C = Commercial (smart money)
The EUR/ USD had steadily been selling off since the end of 2009 and slowly but surely the interest of the smart money and dumb money was reaching extreme levels. At the end of May, interest from commercial traders started to wane while non-commercial trader activity hit another reading of zero. This was a strong sign of imbalance, hinting that the euro’s downtrend was coming to an end. The COT index helped call the bottom with a high degree of accuracy.
The commercial traders will often appear to be doing the opposite of what you would expect as their trades are more a hedge than anything else. Of most interest is the relative position of the commercial traders compared to the non-commercial traders.
The bottom line
Reading the Commitments of Traders report is not an exact science and is best suited for the sort of trader who takes longer-term positions taking into account the bigger picture. The COT4MetaTrader indicator works well although you can certainly get the same information for free online, but I didn’t mind paying a little extra for the convenience of having it all in one chart.
DETAILS:
COT4Metatrader Website: http://www.cot4metatrader.com
Cost: $5.00 per month