 Gaps are an ever-popular feature of the trading landscape as they have their own unique trading characteristics that technical indicators do not capture.
How to define and trade market gaps
There are a number of ways to define a gap, but arguably, the simplest and cleanest definition is made when comparing today’s open to yesterday’s high or low.
This gives us the following definitions:
Gap up: Today’s open is higher than yesterday’s high.
Gap down: Today’s open is lower than yesterday’s low.
Gaps occur between one day’s close and the start of the next day’s action for various reasons. On individual stocks it is usually because the company released big news overnight or just before the open which means traders rush to get in or get out as soon as trading officially opens. On stock market indices such as the S&P 500 or the FTSE 100, gaps occur due to overnight changes of sentiment or big macro news items that impact on the entire market. An example of this might be the US S&P 500 closing positively then China raising interest rates unexpectedly overnight (bad for stocks); European stock markets get knocked when they open and by the time the S&P 500 opens at 2.30PM, the sellers are already lining up, causing the market to gap lower at the open.
Except on Monday morning, daily gaps do not appear on forex markets because they trade 24 hours a day. This means that today’s open is always the same as yesterday’s close give or take a few pips.
Throughout this article I’ll be referring to one market in particular, the US S&P 500 because, according to my research, this market responds best to gap set ups. The S&P 500 is the market to trade, but we’ll be getting our gap data from the Exchange Traded Fund that mimics the S&P 500. The reason for this is that opening price levels for stock indices are usually not reflective of the true opening price. The SPY gives us a better reflection of the first trading price available at the open.
Gap trading strategies
A common gap trading strategy is to “fade” the gap. This means you expect the gap to be closed during the days action. If there is a gap down, then we’d buy the market and if there is a gap up then we’d sell (go short).
Here’s a gap set up on the S&P 500 tracking ETF S P Y.
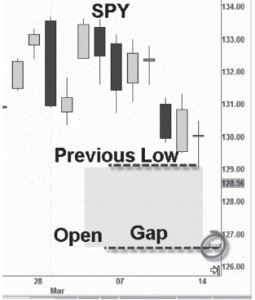
I’ve circled the opening levels of the new day’s. The opening price is far below the previous days low and certainly below the previous day’s close.
A good set up here is to buy the market until the gap is filled, which means having the previous day’s low as a target. As the screenshot below shows, trading the gap fill was a good strategy with the market rallying all day and closing the gap by hitting the previous high before closing slightly lower.

Performance
Fading gaps using the following rules has been a successful strategy since 2000. • Gap up = open above previous high. Target previous high (go short), exit at close otherwise.
• Gap down = open below previous low. Target previous low (go long), exit at close otherwise.
Fade gap ups:
First, here are the returns from fading all gaps up on the S&P 500 tracking ETF SPY since 2000.
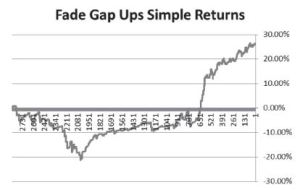
After initially going backwards, fading gap ups has been a profitable strategy overall. There is a high probability of a gap being filled or at least with the market closing in the direction predicted. However, as the results below show, this high success rate comes at a price, with the average winner being just one third the size of an average loss. Put another way, the trade is likely to go your way, but when it doesn’t things can go very wrong.
Successful trades: 81% Average win: 0.30% Average loss: -1.03%
Fade gaps down:
Now, here are the returns from fading all gaps down on the S&P 500 tracking ETF SPY since 2000.
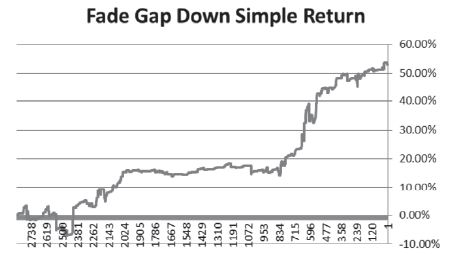
Fading all gaps down has been a more successful strategy, with a total return over 50%, though it seems most of the gains came in the credit crunch and post credit crunch era. Similar to gaps up, gaps down are 82% likely to be filled or close higher than the open, however, the average winner is still much smaller than the average loss.
Successful trades: 82% Average win: 0.44% Average loss: -1.28%
Not all gaps are the same
We can safely say that fading gaps is a high probability set up, but what this doesn’t take into account is the size of the gap. Of course, you’d expect a gap of a few points to be filled, but what about large gaps? Is the opposite more likely to happen with them? For example, if you get a very large gap higher, is this going to be a breakaway gap?
One of the problems in exploring gap size is that simply looking at it in terms of points or % size doesn’t really put things into context. At the height of the credit crunch, the gaps of 0.5% or greater were common place, but between 2003 and 2007 there was hardly a gap of that size registered.
Therefore, the size of a gap needs to be put in context.
The innovative trading developer David Varadi identified this issue and came up with an elegant solution. Gap size is normalised in the context of all such gaps that appeared in the last 50 days. Here is my spin on this idea.
Normalised gap up = Opening gap divided by yesterday’s 14-day moving average. 50 period percent rank of this difference.
Gap down = Absolute opening gap divided by yesterday’s 14 day moving average. 50 period percent rank of this difference.
You don’t need to understand this calculation as I have been working with a colleague to develop a one click tool that will do this for you. You can find details of this tool later.
By normalising gap size we can put all gaps in context. The normalised gap indicator returns a value between 0 and 100 with 0 meaning the smallest gap recorded recently and 100 being the biggest.
To help make sense of the date I’ve split the gaps sizes in to quarters as follows:
Quarter 1: Gaps ranks 0 to 25 (smallest gaps) Quarter 2: Gaps ranks 26 to 50 (medium small gaps) Quarter 3: Gap ranks 51 to 75 (medium large gaps) Quarter 4: Gap ranks 76 to 100 (large gaps)
We can now see the performance of the market in the context of different gap sizes.
First, let’s look at gaps up:
Gaps up normalised rank by quarter (1 = smallest gap)
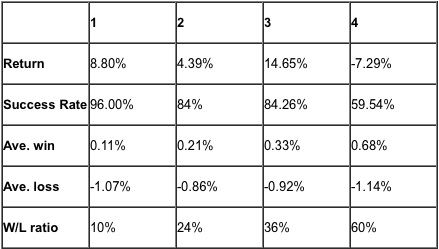
The smallest gaps get filled 96% of the time, but you wouldn’t want to trade these as they are akin to picking up pennies in front of a steamroller. The Win to Loss ratio on these is 10% meaning that the average win is just 10% (1/10th) the size of the average loss!
At the other end of the scale, big gaps up don’t perform too well but for different reasons. The W/L ratio jumps to 60%, but the strike rate drops to 59.54%. The sweet spot for gaps up appears to be those gaps scoring 51 to 75, fitting into the 3rd quarter. These gaps higher are large enough so they are still likely to be filled, but the average move gives you a better reward.
Gaps down normalised rank by quarter (1 = smallest gap)
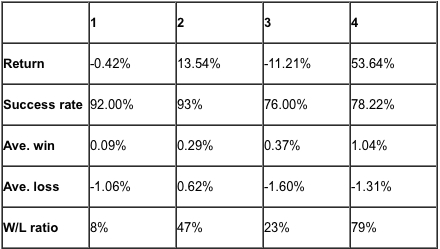
We can see that the sweetest spot of all is with large gaps down. These are filled an incredible 78% of the time with the average win being a respectable 79% the size of the average loss.
In risk reward terms, large gaps higher are the movements to look for.
Application:
There are a number of ways you could apply this gap indicator, from trading the gap fade to fine tuning any day trades you might be making.
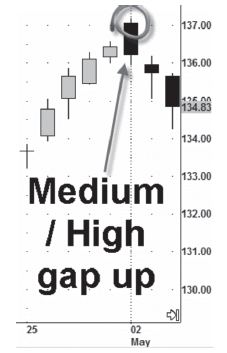
For example, if the market opens with a Quarter 3 sized gap up, you know there is an 84% chance of the market reversing to touch the previous high at some point during the day.
A recent example of this was the Quarter 3 (medium to high) gap up on the 2nd of May that marked the recent top. If you were day trading, it was a good signal to go short that day and for end of day traders it would have given final confirmation of the market’s oversold status. As per the statistics, the market not only filled the gap, it also tested the previous day’s lows.
One thing to keep in mind is that you need to use the S&P 500 ETF to get the signals and determine the size of the gap, but you are likely to be trading the S&P 500 cash index via spread betting. There is nothing to stop you trading the SPY directly, but realistically most readers will trade spread betting so the S&P 500 index is the focus.
Do not be confused if you don’t see a gap on the cash index that is signalled on the SPY. Here’s an example of how a gap could be traded.
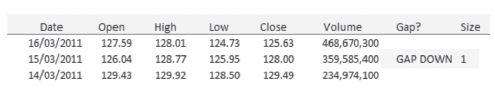
On 15th March, the gap analyser I have created signalled a down gap within the 100% (1.00) category, meaning it was one of the biggest gaps down recorded in recent days.
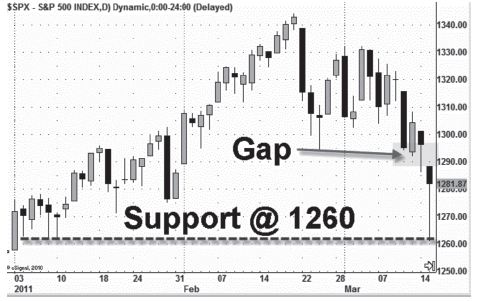
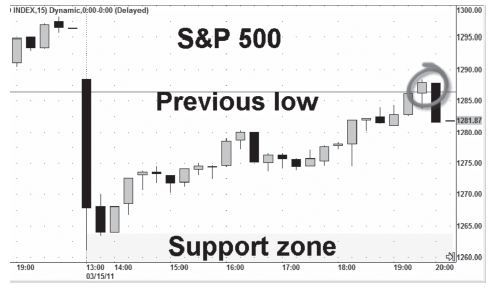
Switching to the cash index you can see the gap on the chart. Then it’s a good idea to note any likely support points where the market might rebound from. Going back there were some support points around 1270 with multiple hammer candles off the 1260 level.
Monitor the market and check how it reacts to various support points. Below you can see a 15 minute chart of the S&P 500 with price bouncing off the 1260 level fairly early. Having waited for confirmation, a good entry might have been 1267 with your profit target being the previous day’s low of 1287. A stop loss could have been placed under the support zone around 1260. The market meandered higher throughout the day and hit the profit target in the final hour of trading for a return of 20 index points.