First up, I wanted to show you something that happened on Wednesday evening…
Mrs Maven was away, which meant that I was on family duty: collecting kids from school; hockey; locating lost shin-pads; taking them to swimming; fixing goggles; burning the baked beans…
… and finally collapsed on the sofa at nearly 10pm…
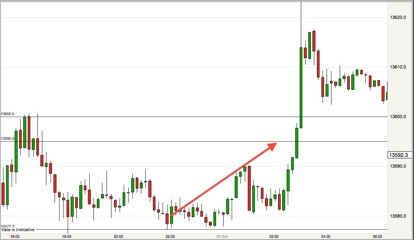
You’d think that the last thing I’d feel like doing was trading. But I’ve been following a new system, and didn’t want to miss out on any action.
So, I flicked on the laptop, and in just a few minutes had popped on this little trade, which (as you can see) quietly went on to win for me, while I was fast asleep in my bed at 3.00 a.m.
I’m still tracking this system, and will bring you a full report on it next week, so please watch out for my email.
But one of the things this trading style has highlighted for me, is the importance of levels – and how levels can be one of the hardest things for novice traders to master (which it is why it’s so nice to have a trading system that does that work for you).
Whatever style of trading you do – whatever technical signals, price action or fundamentals you use – if you’re not looking at LEVELS, you’re putting yourself at a huge disadvantage.
But if you’re really expert at drawing in levels, then, hell, you could probably base your trading signals on the retrograde cycles of the moon.
The value of levels
Prices have long memories, and they tend to behave in the same way at key levels again and again.
So, if you can draw a horizontal line at a key level you’re giving yourself more information about price behaviour that you’d find in a dozen indicators.
What I’m talking about, of course, is support and resistance.
Support and resistance works in all timeframes and in all instruments. It works in trending markets, and in range-bound markets.
It tells us this: if a price has bounced off a level once, it’s likely to do it again.
And if it’s bounced off that level twice, then it’s even more likely to do it next time.
In fact, the more times your price struggles to move through a level, the stronger that area of support or resistance becomes.
In the chart below, we can see the price repeatedly bouncing off the same price level…
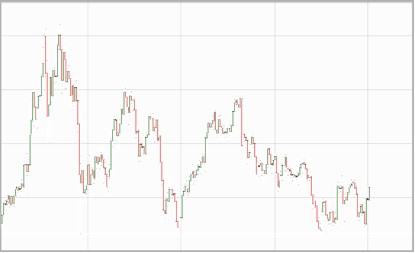
By popping these lines on our charts, we give ourselves inside information on how prices will behave at these key levels.
It is no coincidence that the buyers come into the market whenever the price moves down to this key level.
This is where that price finds support – it’s a level littered with buy orders – where investors believe the price has got ‘too cheap’.
Drawing lines
In technical trading books you’ll find many, many rules about how to draw lines of support and resistance.
The basics are these…
The more often your level is tested, the more valid it becomes.
The more recently a level has been tested, the stronger its support or resistance.
If support is broken, that level becomes resistance. Likewise, if resistance is broken, that level becomes support.
Strictly speaking, the market needs to get rejected at least twice for it to count as support/resistance, but as far as I’m concerned, any reversal point is worth watching for price action.
Using levels
Drawing straight lines on your charts doesn’t constitute a trading strategy in itself, but it can form one of the strongest foundations a trading strategy can have.
In a sideways market, what we’d ideally see is the price playing ping-pong between two neat lines of support and resistance.
Of course, in the real world, charts are rarely that tidy.
I find it helpful to think of my support and resistance lines as ‘areas’ rather than ‘lines’ – when the price gets into these zones, we can start looking for signals.

When lines fail
Of course, the markets would be very dull if we never broke through our support and resistance areas – but when we do, a support level will be come resistance, and vice versa.
There are a number of reasons why this happens…
Let’s say that there’s resistance at 50, but the price drives through this level. All the people with an order to sell at 50 will now be showing a loss.
Their trade plan is in tatters because the resistance level has been breached. When the price drops back to 50, they’ll want to get out of these trades at breakeven. This puts buying pressure into the market.
When prices are breaking key levels, it’ll be trending, and here, the use of support and resistance is less obvious, but it shows us how fluid this technique can be, and teaches us that every turning point can give us valuable knowledge.
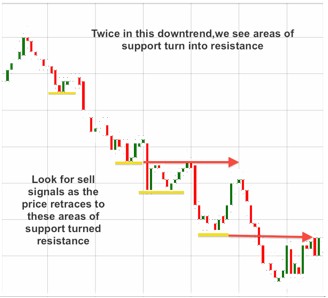
In the chart above, we can see a number of levels where the price found support in this downward trend.
When the price then moved through these levels, it will frequently retrace back to the old support levels, and then find resistance at them.
These simple straight lines are one of the most important fundamentals of trading.
As I said earlier, they can be more powerful than an armful of technical indicators – and if you’re trading without them, you’re putting yourself at a huge disadvantage.
Please don’t forget to watch out for my email next week, where I’ll be showing you exactly how I picked up that trade I mentioned at the top of this email.