 Seattle based Jeff Pietsch is best known for his statistical goldmine, www.etfrewind.com and his popular blog www.etfprophet.com. Jeff’s main service, ETFRewind is primarily aimed at end-of-day traders and those looking to trade longer term relative strength models. However, these longer-term trades only form part of this accomplished trader’s trading arsenal. Jeff is a highly proficient day trader, a calling I know many of my readers aspire to.
In this interview I’ve only been able to scratch the surface of Jeff’s comprehensive day-trading approach which primarily makes use of so-called “market breadth” indicators. These indicators allow you to see what is happening under the bonnet with market moves, often providing you with vital early signals for big market moves.
Interview With Pro Day Trader Jeff Pietsch
1. Tell me a bit about yourself and how you got into trading.
My background is in real estate actually, but when I was in college I was exposed to Excel 1.0 which was a beta product released by Microsoft for early testing. Those early skills I developed back then have followed me through life and have formed a basis for trading and research.
Around 10 years ago I switched out of real estate and took an MBA at Kellogg Business School. I took a position in a company which was part private equity/part hedge fund with a role that was originally looking into legal matters.
An opportunity came up on the hedge fund side and the rest is history. I took the skills and knowledge I acquired over to my personal trading and ETFRewind. My intention with ETFR is to present tools that individual traders don’t generally have access to.
2. How would you describe yourself as a trader?
I like to be diverse in my trading so I take three broad approaches.
1) Relative Strength Trading: This is a momentum model where I compare different markets for their intermediate-term strength and switch into the strongest during certain market phases. For example, you might watch a basket of ETFs (Exchange Traded Funds) that track markets such as the different US stock indices, bonds and gold. The strategy might be to switch into the strongest mover, which at present might be gold. These trades might last from weeks to months.
2) Counter-Trend Swing Trades: For this I select counter-trend opportunities across a basket of US stocks. I might look for battered down stocks ripe for a rebound. These positions might last a few days to a few weeks.
3) Day Trading: I’ll explain more later.
I’ll place greater emphasis on each of these areas depending on market conditions. In 2009 to 2010 volatility dried up so swing trades weren’t so effective, so I placed more relative strength trades.
3. Tell me more about your day trading
For my day trades, I’m certainly not a scalper. I trade E-mini futures such as the E-mini S&P 500.
[NB: you can trade the underlying market via spread betting].
I also trade leveraged ETFs which might, for example, give me double the exposure to a move on a particular market. I do this, not for the leverage, but because it allows me to take the equivalent of a large position without paying the extra trading costs.
I focus on one market at a time because I cannot switch focus between different markets too easily. Each market has behavioural parameters that you become familiar with. You learn to spot which markets are likely to stick within certain range boundaries and how much “noise” you should be able to cope with.
I focus on market internals for my trading signals rather than the market itself. A loose analogy might be that I buy a car based on what I see under the bonnet rather than what it looks like on the outside.
Looking at a chart and seeing a strong up day only tells you half the story, there are many other things going on behind the scenes that I use to give me hints about its possible future direction. For example, is it a broad-based rally with most stocks going up, or is the rally down to big moves from a smaller number of stocks? If it’s the latter, it could be an early hint that the rally will flatter to deceive.
I focused on this area of market dynamics because of my mentor Dr Brett Steenbarger. Dr Brett is a well-known trading psychologist who focused on market internals (aka Market breadth) for his own trading.
The market internals I pay attention to are:
• Up & Down Volume (TRIN/Arms Index): This indicator is available in most advanced charting programs. It plots the volume of stocks being bought vs the volume of stocks being sold in the market. If this difference is narrowing and the market is going up, I often get an early sell signal. If it’s widening, it can be a good trend trade.
• VWAP (Volume Weighted Average Price):
Again, available as standard in most advanced charting programs. This has the characteristics of a moving average, but as its name implies, is determined by both price and volume. The logic is that big moves accompanied by significant volume have more meaning. You can find a good article on VWAP here: http://tinyurl.com/3DZHS4A
• Accumulative Tick. This is a proprietary indicator I have developed. I look at the slope for early signals.
• Relative Volume: This is another proprietary indicator that I have developed. It tracks the market’s volume at certain times compared to the same time period for the last 20 sessions. Why do this? Well, volume spikes around the open, then dips towards lunchtime before picking up in the evening. My relative volume tells me if volume is strong or weak compared to the same time in the past.
• VIX: The Vix is the “fear” index which advances during times of volatility. Intraday, this can also be a useful input. My day trading is based on quant analysis but primarily guided by what by technical indicators are telling me. I don’t have a system as such, much of my trading is based on a summation of these market internals and how they behave at market extremes.
I use TradeStation for most of my trading and NinjaTrader for my E-mini futures day trading. Most of these breadth indicators are available on other professional platforms.
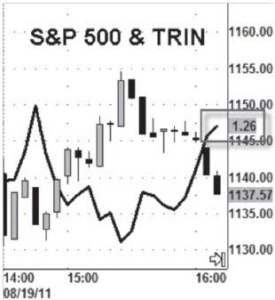
Below you can see a chart of the S&P 500 with the TRIN indicator. This rises with selling pressure and falls with buying pressure.
We can see a period of market chop but the TRIN indicator was rising, indicating rising selling pressure.
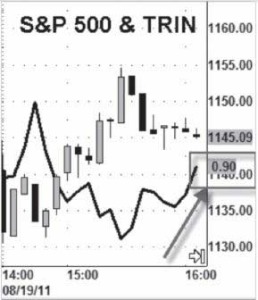
The rising TRIN provided an early hint of coming weakness before the market itself moved lower.
I apply numerous breadth indicators on my chart and rarely focus on just one input, but I hope this example shows the potential here.
[Dave – Many breadth indicators come from external market feeds and so are not available with Meta Trader.]
4. Do you pay much attention to regular technical indicators?
Yes, I do keep my eye on daily pivot points for support and resistance. You can see the power around them, attracting the market like a magnet. As good as it is, I only use it as a signpost. I couldn’t tell you how to build a system around it.
There are also a couple of regular moving averages I know hedge funds and robots look at, so I do pay attention to these.
On a 1 minute chart these are:
• 250 minute EMA: 83 minute on my 3 minute charts.
• 500 minute EMA: 167 minute on my 3 minute charts.
These and the pivot points provide me with alert levels which bring me back to the internals.
Here’s an example 3 minute chart of the E-mini S&P Futures which include these moving averages and a VWAP:
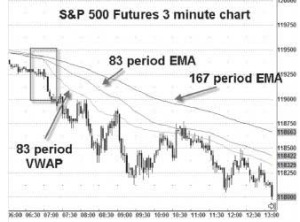
It was an excellent selling day during the European session. Notice how rapidly the VWAP line falls compared to the other two moving averages in the box area highlighted. This indicated that volume was coming in to accompany the down move.
5. How do you manage the size of your positions and risk?
A typical trade lasts 10 minutes to several hours. I’ll aim for a 2:1 risk ratio [my profit target is twice the distance of my exit target], but it doesn’t always work out that way!
My position sizes are determined by my analysis of daily signals or whether I’m hedging a daily position. In general, if my daily signal and intraday set up are pointing in the same direction, then I’ll put on a bigger position and vice versa.
I use very little leverage. Leverage is what kills trading accounts. It always gets you at the worst possible time. Risk management is very important, I find it’s better to take a few nicks and cuts than deep wounds, especially if you can land a trade that makes up for those smaller losses.
6. What are your thoughts on stop losses?
This might be controversial, but I don’t believe in “stop losses”! My stop loss is having the discipline to pull out of a position when the market internals are no longer aligned, not before. I also plan for the day and know what I would do if things do not go my way.
If you are so confident in a stop loss, why don’t you take the opposite trade? E.g. if you are long and get stopped out, why not take a short trade at that point if you’re so confident that it’s the right exit?
To modify my previous statement slightly, I do use a trailing stop once a trade has gone past my profit target.
Having a stop doesn’t mean I hold losing positions and hope, it means I exit positions based on what the market is telling me, not based on a pre- defined loss point. Financial market-makers are hungry for business and hone in on likely stop points to generate trading volume. This is why I don’t keep a stop loss in the market.
For example, the flash crash of May 2010 was one of the saddest days on financial markets in over a decade. People were robbed. The market dropped 9% and the ensuing volume caused many people’s trading screens to freeze. Within minutes, the market had rebounded making up its losses. Anyone exiting at the bottom due to stop losses being triggered would have been robbed of 10% of their account.
7. What tips do you have for beginner traders?
The general evolution of a trader is to first look for the holy grail of indicators, you then evolve to looking at systems. Once you come through this phase you realise that you need to treat trading like a business, and finally you build more of a holistic picture of markets that does not rely on a single indicator or system.
Each step is useful, but be careful not to spend too long searching for that holy grail.
You can come up with a trading system, but you need months of experience to be able to trade it. There is a world of difference between theory and reality. Get to know the market you are trading. Build an intuition to spot early signs of when the market is acting a little differently.
A small tip that has caught many a trader out is to remember that on your charts, candles are automatically adjusted for volatility on your screen. So a bar that seemed huge last week, perhaps a 5 point move, might seem tiny the next week if the market is moving 10 points on each bar. You need to adjust your risk according to the size of the current bars not just how they seem on the screen.
8. What do you think you do well as a trader?
I think I’m good at the research side of things; I’m probably a better researcher than a trader. I think I know how to size my positions well and manage risk. I’m now experienced at being able to remove myself from the action and not panic when things are going against me.
I think I can take a good holistic view of market behaviour trading across indicators while not being reliant on a single one.
9. What has been your biggest mistake and what did you learn from it?
During the credit crisis I tried to buy the dips as the market dropped and dropped. It was a lesson in reading what the market is telling you and spotting when conditions had changed.
10. What advice would you give to new traders?
Start small, don’t rush in. A lot of things in life could be solved by starting small.
For more information on Jeff’s services, visit http://etfprophet.com and http://etfrewind.blogspot.com